ADT 2011 Annual Report Download - page 217
Download and view the complete annual report
Please find page 217 of the 2011 ADT annual report below. You can navigate through the pages in the report by either clicking on the pages listed below, or by using the keyword search tool below to find specific information within the annual report.-
 1
1 -
2
-
3
-
4
-
5
-
6
-
7
-
8
-
9
-
10
-
11
-
12
-
13
-
14
-
15
-
16
-
17
-
18
-
19
-
20
-
21
-
22
-
23
-
24
-
25
-
26
-
27
-
28
-
29
-
30
-
31
-
32
-
33
-
34
-
35
-
36
-
37
-
38
-
39
-
40
-
41
-
42
-
43
-
44
-
45
-
46
-
47
-
48
-
49
-
50
-
51
-
52
-
53
-
54
-
55
-
56
-
57
-
58
-
59
-
60
-
61
-
62
-
63
-
64
-
65
-
66
-
67
-
68
-
69
-
70
-
71
-
72
-
73
-
74
-
75
-
76
-
77
-
78
-
79
-
80
-
81
-
82
-
83
-
84
-
85
-
86
-
87
-
88
-
89
-
90
-
91
-
92
-
93
-
94
-
95
-
96
-
97
-
98
-
99
-
100
-
101
-
102
-
103
-
104
-
105
-
106
-
107
-
108
-
109
-
110
-
111
-
112
-
113
-
114
-
115
-
116
-
117
-
118
-
119
-
120
-
121
-
122
-
123
-
124
-
125
-
126
-
127
-
128
-
129
-
130
-
131
-
132
-
133
-
134
-
135
-
136
-
137
-
138
-
139
-
140
-
141
-
142
-
143
-
144
-
145
-
146
-
147
-
148
-
149
-
150
-
151
-
152
-
153
-
154
-
155
-
156
-
157
-
158
-
159
-
160
-
161
-
162
-
163
-
164
-
165
-
166
-
167
-
168
-
169
-
170
-
171
-
172
-
173
-
174
-
175
-
176
-
177
-
178
-
179
-
180
-
181
-
182
-
183
-
184
-
185
-
186
-
187
-
188
-
189
-
190
-
191
-
192
-
193
-
194
-
195
-
196
-
197
-
198
-
199
-
200
-
201
-
202
-
203
-
204
-
205
-
206
-
 207
207 -
 208
208 -
 209
209 -
 210
210 -
 211
211 -
 212
212 -
 213
213 -
 214
214 -
 215
215 -
 216
216 -
 217
217 -
 218
218 -
 219
219 -
 220
220 -
 221
221 -
 222
222 -
 223
223 -
 224
224 -
 225
225 -
 226
226 -
 227
227 -
228
-
229
-
230
-
231
-
232
-
233
-
234
-
235
-
236
-
237
-
238
-
239
-
240
-
241
-
242
-
243
-
244
-
245
-
246
-
247
-
248
-
249
-
250
-
251
-
252
-
253
-
254
-
255
-
256
-
257
-
258
-
259
-
260
-
261
-
262
-
263
-
264
-
265
-
266
-
267
-
268
-
269
-
270
-
271
-
272
-
273
-
274
-
275
-
276
-
277
-
278
-
279
-
280
-
281
-
282
-
283
-
284
-
285
-
286
-
287
-
288
-
289
-
290
-
291
-
292
-
293
-
294
-
295
-
296
-
297
-
298
-
299
-
300
-
301
-
302
-
303
-
304
-
305
-
306
-
307
-
308
-
309
-
310
-
311
-
312
-
313
 |
 |

TYCO INTERNATIONAL LTD.
NOTES TO CONSOLIDATED FINANCIAL STATEMENTS (Continued)
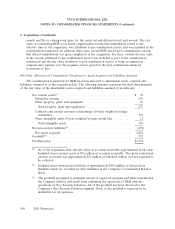
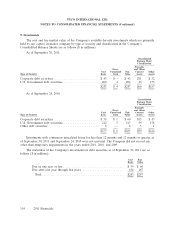
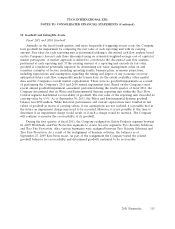
9. Investments
The cost and fair market value of the Company’s available-for-sale investments which are primarily
held by our captive insurance company by type of security and classification in the Company’s
Consolidated Balance Sheets are as follows ($ in millions):
As of September 30, 2011:
Consolidated
Balance Sheet
Classification
Prepaids
Gross and Other
Cost Unrealized Fair Current Other
Type of Security Basis Gain Value Assets Assets
Corporate debt securities ......................... $ 43 $— $ 43 $11 $ 32
U.S. Government debt securities ................... 200 4 204 49 155
$243 $ 4 $247 $60 $187
As of September 24, 2010:
Consolidated
Balance Sheet
Classification
Prepaids
Gross and Other
Cost Unrealized Fair Current Other
Type of Security Basis Gain Value Assets Assets
Corporate debt securities ......................... $ 59 $ 1 $ 60 $15 $ 45
U.S. Government debt securities ................... 212 5 217 39 178
Other debt securities ............................ 6 — 6 5 1
$277 $ 6 $283 $59 $224
Investments with continuous unrealized losses for less than 12 months and 12 months or greater as
of September 30, 2011 and September 24, 2010 were not material. The Company did not record any
other-than-temporary impairments in the years ended 2011, 2010, and 2009.
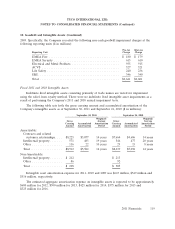
The maturities of the Company’s investments in debt securities as of September 30, 2011 are as
follows ($ in millions):
Cost Fair
Basis Value
Due in one year or less ................................... $ 59 $ 60
Due after one year through five years ........................ 184 187
Total ............................................... $243 $247
114 2011 Financials