ADT 2011 Annual Report Download - page 160
Download and view the complete annual report
Please find page 160 of the 2011 ADT annual report below. You can navigate through the pages in the report by either clicking on the pages listed below, or by using the keyword search tool below to find specific information within the annual report.-
 1
1 -
2
-
3
-
4
-
5
-
6
-
7
-
8
-
9
-
10
-
11
-
12
-
13
-
14
-
15
-
16
-
17
-
18
-
19
-
20
-
21
-
22
-
23
-
24
-
25
-
26
-
27
-
28
-
29
-
30
-
31
-
32
-
33
-
34
-
35
-
36
-
37
-
38
-
39
-
40
-
41
-
42
-
43
-
44
-
45
-
46
-
47
-
48
-
49
-
50
-
51
-
52
-
53
-
54
-
55
-
56
-
57
-
58
-
59
-
60
-
61
-
62
-
63
-
64
-
65
-
66
-
67
-
68
-
69
-
70
-
71
-
72
-
73
-
74
-
75
-
76
-
77
-
78
-
79
-
80
-
81
-
82
-
83
-
84
-
85
-
86
-
87
-
88
-
89
-
90
-
91
-
92
-
93
-
94
-
95
-
96
-
97
-
98
-
99
-
100
-
101
-
102
-
103
-
104
-
105
-
106
-
107
-
108
-
109
-
110
-
111
-
112
-
113
-
114
-
115
-
116
-
117
-
118
-
119
-
120
-
121
-
122
-
123
-
124
-
125
-
126
-
127
-
128
-
129
-
130
-
131
-
132
-
133
-
134
-
135
-
136
-
137
-
138
-
139
-
140
-
141
-
142
-
143
-
144
-
145
-
146
-
147
-
148
-
149
-
 150
150 -
 151
151 -
 152
152 -
 153
153 -
 154
154 -
 155
155 -
 156
156 -
 157
157 -
 158
158 -
 159
159 -
 160
160 -
 161
161 -
 162
162 -
 163
163 -
 164
164 -
 165
165 -
 166
166 -
 167
167 -
 168
168 -
 169
169 -
 170
170 -
171
-
172
-
173
-
174
-
175
-
176
-
177
-
178
-
179
-
180
-
181
-
182
-
183
-
184
-
185
-
186
-
187
-
188
-
189
-
190
-
191
-
192
-
193
-
194
-
195
-
196
-
197
-
198
-
199
-
200
-
201
-
202
-
203
-
204
-
205
-
206
-
207
-
208
-
209
-
210
-
211
-
212
-
213
-
214
-
215
-
216
-
217
-
218
-
219
-
220
-
221
-
222
-
223
-
224
-
225
-
226
-
227
-
228
-
229
-
230
-
231
-
232
-
233
-
234
-
235
-
236
-
237
-
238
-
239
-
240
-
241
-
242
-
243
-
244
-
245
-
246
-
247
-
248
-
249
-
250
-
251
-
252
-
253
-
254
-
255
-
256
-
257
-
258
-
259
-
260
-
261
-
262
-
263
-
264
-
265
-
266
-
267
-
268
-
269
-
270
-
271
-
272
-
273
-
274
-
275
-
276
-
277
-
278
-
279
-
280
-
281
-
282
-
283
-
284
-
285
-
286
-
287
-
288
-
289
-
290
-
291
-
292
-
293
-
294
-
295
-
296
-
297
-
298
-
299
-
300
-
301
-
302
-
303
-
304
-
305
-
306
-
307
-
308
-
309
-
310
-
311
-
312
-
313
 |
 |

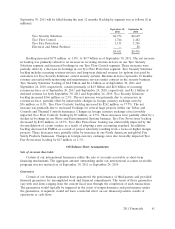
Cash flow from operating activities
The sources of our cash flow from operating activities and the use of a portion of that cash in our
operations for the years ended September 30, 2011, September 24, 2010 and September 25, 2009 are as
follows ($ in millions):
2011 2010 2009
Cash flows from operating activities:
Operating income (loss) ......................... $2,119 $1,598 $(1,506)
Goodwill and intangible asset impairments ........... — — 2,705
Depreciation and amortization(1) .................. 1,318 1,203 1,126
(Gain) loss on divestitures ....................... (230) (41) 13
Non-cash compensation expense ................... 110 120 103
Deferred income taxes .......................... 91 (129) (90)
Provision for losses on accounts receivable and inventory . 82 127 156
Other, net ................................... 67 37 80
Net change in working capital .................... (584) 106 128
Interest income ............................... 34 31 44
Interest expense .............................. (244) (284) (301)
Income tax expense ............................ (326) (138) (71)
Net cash provided by operating activities ............ $2,437 $2,630 $ 2,387
Other cash flow items:
Capital expenditures, net(2) ....................... $(779) $ (689) $ (690)
Increase (decrease) in the sale of accounts receivable . . . 1 (2) 10
Accounts purchased by ADT ..................... (614) (559) (543)
Purchase accounting and holdback liabilities .......... (10) (3) (2)
Voluntary pension contributions ................... 15 — 22
(1) Includes depreciation expense of $695 million, $654 million, and $610 million in 2011,
2010 and 2009, respectively, and amortization of intangible assets of $623 million,
$549 million, and $516 million in 2011, 2010 and 2009, respectively.
(2) Includes net proceeds received for the sale/disposition of property, plant and equipment
of $9 million, $29 million, and $12 million in 2011, 2010 and 2009, respectively
The net change in working capital decreased operating cash flow by $584 million in 2011. The
significant changes in working capital included a $271 million decrease in accrued and other liabilities,
a $187 million increase in accounts receivable and a $137 million increase in inventories.
The net change in working capital increased operating cash flow by $106 million in 2010. The
significant changes in working capital included a $119 million increase in accounts payable and an
$88 million decrease in prepaid and other current assets which were partially offset by a $108 million
increase in inventories.
The net change in working capital increased operating cash flow by $128 million in 2009. The
significant changes in working capital included a $346 million decrease in inventory, a $191 million
decrease in accounts receivable, a $106 million net decrease in contracts in progress, partially offset by
a $337 million decrease in accounts payable and a $138 million decrease in income taxes, net.
During 2011, 2010 and 2009, we paid approximately $114 million, $160 million (inclusive of
$2 million relating to the French security business being classified as held for sale) and $152 million,
respectively, in cash related to restructuring activities. See Note 4 to our Consolidated Financial
Statements for further information regarding our restructuring activities.
During the years ended September 30, 2011, September 24, 2010 and September 25, 2009 we made
required contributions of $78 million, $82 million and $60 million, respectively to our U.S. and
2011 Financials 57