ADT 2011 Annual Report Download - page 67
Download and view the complete annual report
Please find page 67 of the 2011 ADT annual report below. You can navigate through the pages in the report by either clicking on the pages listed below, or by using the keyword search tool below to find specific information within the annual report.-
 1
1 -
2
-
3
-
4
-
5
-
6
-
7
-
8
-
9
-
10
-
11
-
12
-
13
-
14
-
15
-
16
-
17
-
18
-
19
-
20
-
21
-
22
-
23
-
24
-
25
-
26
-
27
-
28
-
29
-
30
-
31
-
32
-
33
-
34
-
35
-
36
-
37
-
38
-
39
-
40
-
41
-
42
-
43
-
44
-
45
-
46
-
47
-
48
-
49
-
50
-
51
-
52
-
53
-
54
-
55
-
56
-
 57
57 -
 58
58 -
 59
59 -
 60
60 -
 61
61 -
 62
62 -
 63
63 -
 64
64 -
 65
65 -
 66
66 -
 67
67 -
 68
68 -
 69
69 -
 70
70 -
 71
71 -
 72
72 -
 73
73 -
 74
74 -
 75
75 -
 76
76 -
 77
77 -
78
-
79
-
80
-
81
-
82
-
83
-
84
-
85
-
86
-
87
-
88
-
89
-
90
-
91
-
92
-
93
-
94
-
95
-
96
-
97
-
98
-
99
-
100
-
101
-
102
-
103
-
104
-
105
-
106
-
107
-
108
-
109
-
110
-
111
-
112
-
113
-
114
-
115
-
116
-
117
-
118
-
119
-
120
-
121
-
122
-
123
-
124
-
125
-
126
-
127
-
128
-
129
-
130
-
131
-
132
-
133
-
134
-
135
-
136
-
137
-
138
-
139
-
140
-
141
-
142
-
143
-
144
-
145
-
146
-
147
-
148
-
149
-
150
-
151
-
152
-
153
-
154
-
155
-
156
-
157
-
158
-
159
-
160
-
161
-
162
-
163
-
164
-
165
-
166
-
167
-
168
-
169
-
170
-
171
-
172
-
173
-
174
-
175
-
176
-
177
-
178
-
179
-
180
-
181
-
182
-
183
-
184
-
185
-
186
-
187
-
188
-
189
-
190
-
191
-
192
-
193
-
194
-
195
-
196
-
197
-
198
-
199
-
200
-
201
-
202
-
203
-
204
-
205
-
206
-
207
-
208
-
209
-
210
-
211
-
212
-
213
-
214
-
215
-
216
-
217
-
218
-
219
-
220
-
221
-
222
-
223
-
224
-
225
-
226
-
227
-
228
-
229
-
230
-
231
-
232
-
233
-
234
-
235
-
236
-
237
-
238
-
239
-
240
-
241
-
242
-
243
-
244
-
245
-
246
-
247
-
248
-
249
-
250
-
251
-
252
-
253
-
254
-
255
-
256
-
257
-
258
-
259
-
260
-
261
-
262
-
263
-
264
-
265
-
266
-
267
-
268
-
269
-
270
-
271
-
272
-
273
-
274
-
275
-
276
-
277
-
278
-
279
-
280
-
281
-
282
-
283
-
284
-
285
-
286
-
287
-
288
-
289
-
290
-
291
-
292
-
293
-
294
-
295
-
296
-
297
-
298
-
299
-
300
-
301
-
302
-
303
-
304
-
305
-
306
-
307
-
308
-
309
-
310
-
311
-
312
-
313
 |
 |

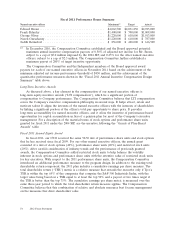
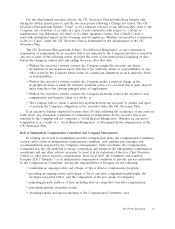
Fiscal 2011 Annual Incentive Compensation Design Summary
Performance Actual
Performance Measure Weights Target Performance
Messrs. Breen and Sklarsky and Ms. Reinsdorf
•Earnings per Share from continuing operations before
special items (‘‘EPS’’) ........................ 40% $3.00 per share $3.24 per share
•Free Cash Flow (‘‘Adjusted FCF’’) before special items . 40% $ 1.41 billion $ 1.35 billion
•Total Revenue (in constant currency and excluding EMP
revenue) .................................. 20% $ 16.16 billion $ 16.66 billion
Mr. Gursahaney
•Operating Income of Tyco Security Solutions before
special items ............................... 35% $ 1.38 billion $ 1.43 billion
•Adjusted FCF of Tyco Security Solutions ........... 25% $ 1.46 billion $ 1.38 billion
•Revenue of Tyco Security Solutions (in constant
currency) ................................. 20% $ 8.29 billion $ 8.52 billion
•Corporate ................................. 20% See above See above
Mr. Oliver
•Operating Income of Fire Protection before special
items .................................... 35% $ 553.8 million $ 624.8 million
•Revenue of Fire Protection (in constant currency) ..... 20% $ 4.47 billion $ 4.62 billion
•Adjusted FCF for Fire Protection Services .......... 15% $ 336.8 million $ 346.6 million
•Working Capital Days Fire Protection Products ...... 10% 81 days 84.5 days
•Corporate ................................. 20% See above See above
Description of Performance Measures: For compensation purposes, EPS from continuing
operations, Adjusted FCF, and operating income are adjusted to exclude the effects of events that the
Compensation Committee deems do not reflect the performance of the named executive officers. The
categories of special items are identified at the time the performance measure is approved at the
beginning of the fiscal year, although the Compensation Committee may at its discretion make
adjustments during the fiscal year. Special items include gains, losses or cash outlays that may mask the
underlying operating results and/or business trends of the Company or business segment, as applicable.
For fiscal 2011, the approved categories of adjustments included adjustments related to (i) business
acquisitions and divestitures; (ii) debt refinancing; (iii) legacy legal and tax matters; (iv) goodwill and
intangible asset impairments; (v) tax law changes; (vi) certain unbudgeted capital expenditures;
(vii) unbudgeted restructuring charges; and (viii) realignments of segment and corporate costs. At the
beginning of the fiscal year, the Compensation Committee also decided that it would be appropriate to
continue to limit the effects of the volatility inherent in the EMP business segment (a majority of which
was sold in the first fiscal quarter) on the performance measures applicable to the corporate level.
Adjusted FCF is calculated by first adjusting cash flow from operations by removing the effects of the
sale of accounts receivable programs, cash paid for purchase accounting and holdback liabilities, and
voluntary pension contributions and then deducting net capital expenditures (including accounts
purchased from the ADT dealer network), and then adding back the special items that increased or
decreased cash flows. Working capital days are generally calculated by dividing annualized average
working capital by revenue of the applicable unit. Revenue is calculated in constant currency, which
negates the impact of fluctuations in foreign currency over the course of the year, with adjustments
made to targets to reflect the acquisition or divestitures of businesses over the course of the fiscal year.
The table below shows the maximum and target annual incentive compensation opportunities for
fiscal 2011, and the actual payments earned by each of our named executive officers. These amounts
are reported in the ‘‘Non-Equity Incentive Plan Compensation’’ column of the ‘‘Summary
Compensation’’ table.
2012 Proxy Statement 53