ADT 2011 Annual Report Download - page 262
Download and view the complete annual report
Please find page 262 of the 2011 ADT annual report below. You can navigate through the pages in the report by either clicking on the pages listed below, or by using the keyword search tool below to find specific information within the annual report.-
 1
1 -
2
-
3
-
4
-
5
-
6
-
7
-
8
-
9
-
10
-
11
-
12
-
13
-
14
-
15
-
16
-
17
-
18
-
19
-
20
-
21
-
22
-
23
-
24
-
25
-
26
-
27
-
28
-
29
-
30
-
31
-
32
-
33
-
34
-
35
-
36
-
37
-
38
-
39
-
40
-
41
-
42
-
43
-
44
-
45
-
46
-
47
-
48
-
49
-
50
-
51
-
52
-
53
-
54
-
55
-
56
-
57
-
58
-
59
-
60
-
61
-
62
-
63
-
64
-
65
-
66
-
67
-
68
-
69
-
70
-
71
-
72
-
73
-
74
-
75
-
76
-
77
-
78
-
79
-
80
-
81
-
82
-
83
-
84
-
85
-
86
-
87
-
88
-
89
-
90
-
91
-
92
-
93
-
94
-
95
-
96
-
97
-
98
-
99
-
100
-
101
-
102
-
103
-
104
-
105
-
106
-
107
-
108
-
109
-
110
-
111
-
112
-
113
-
114
-
115
-
116
-
117
-
118
-
119
-
120
-
121
-
122
-
123
-
124
-
125
-
126
-
127
-
128
-
129
-
130
-
131
-
132
-
133
-
134
-
135
-
136
-
137
-
138
-
139
-
140
-
141
-
142
-
143
-
144
-
145
-
146
-
147
-
148
-
149
-
150
-
151
-
152
-
153
-
154
-
155
-
156
-
157
-
158
-
159
-
160
-
161
-
162
-
163
-
164
-
165
-
166
-
167
-
168
-
169
-
170
-
171
-
172
-
173
-
174
-
175
-
176
-
177
-
178
-
179
-
180
-
181
-
182
-
183
-
184
-
185
-
186
-
187
-
188
-
189
-
190
-
191
-
192
-
193
-
194
-
195
-
196
-
197
-
198
-
199
-
200
-
201
-
202
-
203
-
204
-
205
-
206
-
207
-
208
-
209
-
210
-
211
-
212
-
213
-
214
-
215
-
216
-
217
-
218
-
219
-
220
-
221
-
222
-
223
-
224
-
225
-
226
-
227
-
228
-
229
-
230
-
231
-
232
-
233
-
234
-
235
-
236
-
237
-
238
-
239
-
240
-
241
-
242
-
243
-
244
-
245
-
246
-
247
-
248
-
249
-
250
-
251
-
 252
252 -
 253
253 -
 254
254 -
 255
255 -
 256
256 -
 257
257 -
 258
258 -
 259
259 -
 260
260 -
 261
261 -
 262
262 -
 263
263 -
 264
264 -
 265
265 -
 266
266 -
 267
267 -
 268
268 -
 269
269 -
 270
270 -
 271
271 -
 272
272 -
273
-
274
-
275
-
276
-
277
-
278
-
279
-
280
-
281
-
282
-
283
-
284
-
285
-
286
-
287
-
288
-
289
-
290
-
291
-
292
-
293
-
294
-
295
-
296
-
297
-
298
-
299
-
300
-
301
-
302
-
303
-
304
-
305
-
306
-
307
-
308
-
309
-
310
-
311
-
312
-
313
 |
 |

TYCO INTERNATIONAL LTD.
NOTES TO CONSOLIDATED FINANCIAL STATEMENTS (Continued)
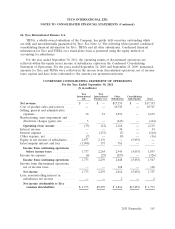
21. Consolidated Segment Data (Continued)
2011 2010 2009
Capital expenditures
Tyco Security Solutions .............................. $620 $511 $467
Tyco Fire Protection ................................ 69 59 57
Tyco Flow Control ................................. 82 98 100
Electrical and Metal Products ......................... 12 48 46
Corporate and Other ............................... 5 2 32
$788 $718 $702
Net revenue by geographic area for the years ended September 30, 2011, September 24, 2010 and
September 25, 2009 is as follows ($ in millions):
2011(2) 2010(2) 2009(2)
Net Revenue(1):
United States .............................. $ 8,291 $ 8,266 $ 8,304
Other Americas ............................. 1,792 1,726 1,520
Europe, Middle East and Africa ................. 4,031 3,990 4,351
Asia-Pacific ................................ 3,241 3,034 2,707
$17,355 $17,016 $16,882
(1) Revenue is attributed to individual countries based on the reporting entity that records
the transaction.
(2) Fiscal 2011 was a 53-week year. Fiscal years 2010 and 2009 were 52-week years.
Long-lived assets by geographic area as of September 30, 2011, September 24, 2010 and
September 25, 2009 are as follows ($ in millions):
2011 2010 2009
Long-lived assets(1):
United States ................................. $3,139 $3,324 $2,661
Other Americas ............................... 436 448 402
Europe, Middle East and Africa ................... 498 424 478
Asia-Pacific .................................. 739 665 605
Corporate and Other ........................... 43 43 54
$4,855 $4,904 $4,200
(1) Long-lived assets are comprised primarily of property, plant and equipment and exclude
goodwill, other intangible assets, deferred taxes and other shared assets.
2011 Financials 159