ADT 2011 Annual Report Download - page 143
Download and view the complete annual report
Please find page 143 of the 2011 ADT annual report below. You can navigate through the pages in the report by either clicking on the pages listed below, or by using the keyword search tool below to find specific information within the annual report.-
 1
1 -
2
-
3
-
4
-
5
-
6
-
7
-
8
-
9
-
10
-
11
-
12
-
13
-
14
-
15
-
16
-
17
-
18
-
19
-
20
-
21
-
22
-
23
-
24
-
25
-
26
-
27
-
28
-
29
-
30
-
31
-
32
-
33
-
34
-
35
-
36
-
37
-
38
-
39
-
40
-
41
-
42
-
43
-
44
-
45
-
46
-
47
-
48
-
49
-
50
-
51
-
52
-
53
-
54
-
55
-
56
-
57
-
58
-
59
-
60
-
61
-
62
-
63
-
64
-
65
-
66
-
67
-
68
-
69
-
70
-
71
-
72
-
73
-
74
-
75
-
76
-
77
-
78
-
79
-
80
-
81
-
82
-
83
-
84
-
85
-
86
-
87
-
88
-
89
-
90
-
91
-
92
-
93
-
94
-
95
-
96
-
97
-
98
-
99
-
100
-
101
-
102
-
103
-
104
-
105
-
106
-
107
-
108
-
109
-
110
-
111
-
112
-
113
-
114
-
115
-
116
-
117
-
118
-
119
-
120
-
121
-
122
-
123
-
124
-
125
-
126
-
127
-
128
-
129
-
130
-
131
-
132
-
 133
133 -
 134
134 -
 135
135 -
 136
136 -
 137
137 -
 138
138 -
 139
139 -
 140
140 -
 141
141 -
 142
142 -
 143
143 -
 144
144 -
 145
145 -
 146
146 -
 147
147 -
 148
148 -
 149
149 -
 150
150 -
 151
151 -
 152
152 -
 153
153 -
154
-
155
-
156
-
157
-
158
-
159
-
160
-
161
-
162
-
163
-
164
-
165
-
166
-
167
-
168
-
169
-
170
-
171
-
172
-
173
-
174
-
175
-
176
-
177
-
178
-
179
-
180
-
181
-
182
-
183
-
184
-
185
-
186
-
187
-
188
-
189
-
190
-
191
-
192
-
193
-
194
-
195
-
196
-
197
-
198
-
199
-
200
-
201
-
202
-
203
-
204
-
205
-
206
-
207
-
208
-
209
-
210
-
211
-
212
-
213
-
214
-
215
-
216
-
217
-
218
-
219
-
220
-
221
-
222
-
223
-
224
-
225
-
226
-
227
-
228
-
229
-
230
-
231
-
232
-
233
-
234
-
235
-
236
-
237
-
238
-
239
-
240
-
241
-
242
-
243
-
244
-
245
-
246
-
247
-
248
-
249
-
250
-
251
-
252
-
253
-
254
-
255
-
256
-
257
-
258
-
259
-
260
-
261
-
262
-
263
-
264
-
265
-
266
-
267
-
268
-
269
-
270
-
271
-
272
-
273
-
274
-
275
-
276
-
277
-
278
-
279
-
280
-
281
-
282
-
283
-
284
-
285
-
286
-
287
-
288
-
289
-
290
-
291
-
292
-
293
-
294
-
295
-
296
-
297
-
298
-
299
-
300
-
301
-
302
-
303
-
304
-
305
-
306
-
307
-
308
-
309
-
310
-
311
-
312
-
313
 |
 |

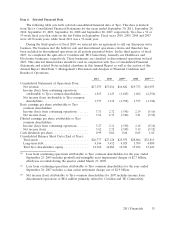
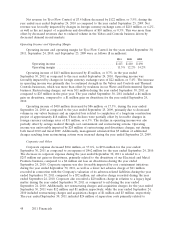
Tyco Security Solutions
Net Revenue
Net revenue for Tyco Security Solutions for the years ended September 30, 2011, September 24,
2010 and September 25, 2009 were as follows ($ in millions):
2011 2010 2009
Service revenue
Recurring .................................. $4,907 $4,295 $3,861
Non-recurring ............................... 729 709 951
Total service revenue ........................... 5,636 5,004 4,812(1)
Revenue from product sales (non-recurring)
System installation and related products ............ 2,584 2,377 2,255
Security products ............................ 406 353 308
Total revenue from product sales ................... 2,990 2,730 2,563(1)
Net revenue .................................. $8,626 $7,734 $7,375
(1) As discussed in Note 1 to the Consolidated Financial Statements, revenue related to the
sale of electronic tags and labels utilized in retailer anti-theft systems is classified as
revenue from product sales. In reporting periods prior to the first quarter of fiscal 2010,
revenue related to the sale of electronic tags and labels utilized in retailer anti-theft
systems was misclassified as service revenue. Such item had no effect on net revenue,
operating income (loss), net income (loss) and cash flows. No changes have been made to
previously filed financial statements or in the comparative amounts presented herein, as
the effect in prior periods is not material. Revenue related to the sale of such electronic
tags and labels reflected as service revenue was $286 million in 2009 and related cost of
services was $176 million in 2009.
Net revenue for Tyco Security Solutions of $8.6 billion increased by $892 million, or 11.5%, during
the year ended September 30, 2011 as compared to the year ended September 24, 2010. Net revenue
was favorably impacted by the estimated net impact of acquisitions and divestitures of $235 million, or
3.0%, substantially all of which was related to the acquisition of Broadview Security in May 2010, and
to a lesser extent, Signature Security Group in April 2011, offset by divested revenue from our French
Security business which was sold in March 2010. Changes in foreign currency exchange rates also
favorably impacted net revenue by $192 million, or 2.5%. In addition, an estimated $38 million, or
0.5%, of revenue is attributable to the additional week in fiscal 2011, all of which is non-recurring. The
remaining increase in net revenue was primarily due to incremental account growth, net of attrition, in
the recurring revenue businesses in North America and Rest of World (‘‘ROW’’), and strength in our
non-recurring businesses related to construction project activity and security system upgrades in North
America and retail store expansion activity in ROW.
Net revenue for Tyco Security Solutions of $7.7 billion increased by $359 million, or 4.9%, during
the year ended September 24, 2010 as compared to September 25, 2009. Net revenue was favorably
impacted by changes in foreign currency exchange rates of $239 million, or 3.2%. Net revenue was also
favorably impacted by the net impact of acquisitions and divestitures of $72 million, or 1.0%, which was
primarily the result of $193 million in net revenue estimated to be contributed by the Broadview
Security acquisition partially offset by $109 million of divested revenue relating to our French security
business.
40 2011 Financials