ADT 2011 Annual Report Download - page 81
Download and view the complete annual report
Please find page 81 of the 2011 ADT annual report below. You can navigate through the pages in the report by either clicking on the pages listed below, or by using the keyword search tool below to find specific information within the annual report.-
 1
1 -
2
-
3
-
4
-
5
-
6
-
7
-
8
-
9
-
10
-
11
-
12
-
13
-
14
-
15
-
16
-
17
-
18
-
19
-
20
-
21
-
22
-
23
-
24
-
25
-
26
-
27
-
28
-
29
-
30
-
31
-
32
-
33
-
34
-
35
-
36
-
37
-
38
-
39
-
40
-
41
-
42
-
43
-
44
-
45
-
46
-
47
-
48
-
49
-
50
-
51
-
52
-
53
-
54
-
55
-
56
-
57
-
58
-
59
-
60
-
61
-
62
-
63
-
64
-
65
-
66
-
67
-
68
-
69
-
70
-
 71
71 -
 72
72 -
 73
73 -
 74
74 -
 75
75 -
 76
76 -
 77
77 -
 78
78 -
 79
79 -
 80
80 -
 81
81 -
 82
82 -
 83
83 -
 84
84 -
 85
85 -
 86
86 -
 87
87 -
 88
88 -
 89
89 -
 90
90 -
 91
91 -
92
-
93
-
94
-
95
-
96
-
97
-
98
-
99
-
100
-
101
-
102
-
103
-
104
-
105
-
106
-
107
-
108
-
109
-
110
-
111
-
112
-
113
-
114
-
115
-
116
-
117
-
118
-
119
-
120
-
121
-
122
-
123
-
124
-
125
-
126
-
127
-
128
-
129
-
130
-
131
-
132
-
133
-
134
-
135
-
136
-
137
-
138
-
139
-
140
-
141
-
142
-
143
-
144
-
145
-
146
-
147
-
148
-
149
-
150
-
151
-
152
-
153
-
154
-
155
-
156
-
157
-
158
-
159
-
160
-
161
-
162
-
163
-
164
-
165
-
166
-
167
-
168
-
169
-
170
-
171
-
172
-
173
-
174
-
175
-
176
-
177
-
178
-
179
-
180
-
181
-
182
-
183
-
184
-
185
-
186
-
187
-
188
-
189
-
190
-
191
-
192
-
193
-
194
-
195
-
196
-
197
-
198
-
199
-
200
-
201
-
202
-
203
-
204
-
205
-
206
-
207
-
208
-
209
-
210
-
211
-
212
-
213
-
214
-
215
-
216
-
217
-
218
-
219
-
220
-
221
-
222
-
223
-
224
-
225
-
226
-
227
-
228
-
229
-
230
-
231
-
232
-
233
-
234
-
235
-
236
-
237
-
238
-
239
-
240
-
241
-
242
-
243
-
244
-
245
-
246
-
247
-
248
-
249
-
250
-
251
-
252
-
253
-
254
-
255
-
256
-
257
-
258
-
259
-
260
-
261
-
262
-
263
-
264
-
265
-
266
-
267
-
268
-
269
-
270
-
271
-
272
-
273
-
274
-
275
-
276
-
277
-
278
-
279
-
280
-
281
-
282
-
283
-
284
-
285
-
286
-
287
-
288
-
289
-
290
-
291
-
292
-
293
-
294
-
295
-
296
-
297
-
298
-
299
-
300
-
301
-
302
-
303
-
304
-
305
-
306
-
307
-
308
-
309
-
310
-
311
-
312
-
313
 |
 |

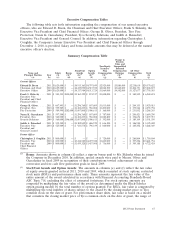
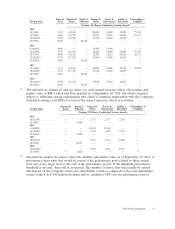
Executive Compensation Tables
The following table sets forth information regarding the compensation of our named executive
officers, who are Edward D. Breen, the Chairman and Chief Executive Officer; Frank S. Sklarsky, the
Executive Vice President and Chief Financial Officer; George R. Oliver, President, Tyco Fire
Protection; Naren K. Gursahaney, President, Tyco Security Solutions, and Judith A. Reinsdorf,
Executive Vice President and General Counsel. In addition, information regarding Christopher J.
Coughlin, the Company’s former Executive Vice President and Chief Financial Officer through
December 1, 2010, is provided. Salary and bonus include amounts that may be deferred at the named
executive officer’s election.
Summary Compensation Table
Change in
Pension
Value and
Non-Equity Nonqualified
Incentive Deferred
Stock/Unit Option Plan Compensation All Other
Name and Salary Bonus Awards Awards Compensation Earnings Compensation Total
Principal Position Year ($) ($)(1) ($)(2) ($)(2) ($)(3) ($)(4) ($)(5) ($)
(a) (b) (c) (d) (e) (f) (g) (h) (i) (j)
Current Officers
Edward D. Breen ....2011 $1,625,000 $ — $4,913,163 $4,797,849 $2,925,000 $3,880,000 $2,238,610 $20,379,622
Chairman and Chief 2010 $1,625,000 $ — $4,419,090 $4,515,932 $4,062,500 $3,842,000 $1,404,351 $19,868,873
Executive Officer 2009 $1,625,000 $ — $4,317,984 $4,313,724 $1,869,000 $4,542,000 $1,127,677 $17,795,385
Frank S. Sklarsky ....2011 $ 583,333 $500,000 $3,163,322 $ 874,517 $1,008,000 $ — $ 140,502 $ 6,269,674
Executive Vice
President and Chief
Financial Officer
George R. Oliver .....2011 $ 607,493 $ — $1,296,760 $ 807,609 $1,013,000 $ — $ 204,153 $ 3,929,015
President, Tyco 2010 $ 599,989 $ — $1,104,233 $ 956,008 $1,200,000 $ — $ 175,564 $ 4,035,794
Fire Protection 2009 $ 589,990 $282,000 $1,007,808 $1,006,613 $ 168,000 $ — $ 231,832 $ 3,286,243
Naren K. Gursahaney . 2011 $ 597,500 $ — $1,296,760 $ 807,609 $ 787,000 $ — $ 200,421 $ 3,689,290
President, Tyco 2010 $ 560,000 $ — $1,104,233 $ 956,008 $1,080,800 $ — $ 176,674 $ 3,877,715
Security Solutions 2009 $ 560,000 $146,000 $1,007,808 $1,006,613 $ 392,000 $ — $ 189,109 $ 3,301,530
Judith A. Reinsdorf . . . 2011 $ 532,500 $ — $1,102,852 $ 686,570 $ 616,500 $ — $ 186,980 $ 3,125,402
Executive Vice 2010 $ 525,000 $ — $ 921,578 $ 796,339 $ 840,000 $ — $ 185,452 $ 3,268,369
President and
General Counsel
Former Officer
Christopher J. Coughlin 2011 $ 800,000 $ — $ — $ — $ 720,000 $ — $ 260,804 $ 1,780,804
Executive Vice 2010 $ 800,000 $ — $3,416,580 $4,497,948 $1,600,000 $ — $ 307,226 $10,621,754
President and 2009 $ 800,000 $ — $1,439,328 $1,437,908 $ 736,000 $ — $ 309,188 $ 4,722,424
Chief Financial
Officer
(1) Bonus: Amounts shown in column (d) reflect a sign-on bonus paid to Mr. Sklarsky when he joined
the Company in December 2010. In addition, special awards were paid to Messrs. Oliver and
Gursahaney in fiscal 2009 in recognition of their contributions toward achievement of cash
conversion and free cash flow generation goals in fiscal 2009.
(2) Stock/Unit Awards and Option Awards: The amounts in columns (e) and (f) reflect the fair value
of equity awards granted in fiscal 2011, 2010 and 2009, which consisted of stock options, restricted
stock units (RSUs) and performance share units. These amounts represent the fair value of the
entire amount of the award calculated in accordance with Financial Accounting Standards Board
ASC Topic 718, excluding the effect of estimated forfeitures. For stock options, amounts are
computed by multiplying the fair value of the award (as determined under the Black-Scholes
option pricing model) by the total number of options granted. For RSUs, fair value is computed by
multiplying the total number of shares subject to the award by the closing market price of Tyco
common stock on the date of grant. For performance share units, fair value is based on a model
that considers the closing market price of Tyco common stock on the date of grant, the range of
2012 Proxy Statement 67