ADT 2011 Annual Report Download - page 10
Download and view the complete annual report
Please find page 10 of the 2011 ADT annual report below. You can navigate through the pages in the report by either clicking on the pages listed below, or by using the keyword search tool below to find specific information within the annual report.-
 1
1 -
 2
2 -
 3
3 -
 4
4 -
 5
5 -
 6
6 -
 7
7 -
 8
8 -
 9
9 -
 10
10 -
 11
11 -
 12
12 -
 13
13 -
 14
14 -
 15
15 -
 16
16 -
 17
17 -
 18
18 -
 19
19 -
 20
20 -
 21
21 -
22
-
23
-
24
-
25
-
26
-
27
-
28
-
29
-
30
-
31
-
32
-
33
-
34
-
35
-
36
-
37
-
38
-
39
-
40
-
41
-
42
-
43
-
44
-
45
-
46
-
47
-
48
-
49
-
50
-
51
-
52
-
53
-
54
-
55
-
56
-
57
-
58
-
59
-
60
-
61
-
62
-
63
-
64
-
65
-
66
-
67
-
68
-
69
-
70
-
71
-
72
-
73
-
74
-
75
-
76
-
77
-
78
-
79
-
80
-
81
-
82
-
83
-
84
-
85
-
86
-
87
-
88
-
89
-
90
-
91
-
92
-
93
-
94
-
95
-
96
-
97
-
98
-
99
-
100
-
101
-
102
-
103
-
104
-
105
-
106
-
107
-
108
-
109
-
110
-
111
-
112
-
113
-
114
-
115
-
116
-
117
-
118
-
119
-
120
-
121
-
122
-
123
-
124
-
125
-
126
-
127
-
128
-
129
-
130
-
131
-
132
-
133
-
134
-
135
-
136
-
137
-
138
-
139
-
140
-
141
-
142
-
143
-
144
-
145
-
146
-
147
-
148
-
149
-
150
-
151
-
152
-
153
-
154
-
155
-
156
-
157
-
158
-
159
-
160
-
161
-
162
-
163
-
164
-
165
-
166
-
167
-
168
-
169
-
170
-
171
-
172
-
173
-
174
-
175
-
176
-
177
-
178
-
179
-
180
-
181
-
182
-
183
-
184
-
185
-
186
-
187
-
188
-
189
-
190
-
191
-
192
-
193
-
194
-
195
-
196
-
197
-
198
-
199
-
200
-
201
-
202
-
203
-
204
-
205
-
206
-
207
-
208
-
209
-
210
-
211
-
212
-
213
-
214
-
215
-
216
-
217
-
218
-
219
-
220
-
221
-
222
-
223
-
224
-
225
-
226
-
227
-
228
-
229
-
230
-
231
-
232
-
233
-
234
-
235
-
236
-
237
-
238
-
239
-
240
-
241
-
242
-
243
-
244
-
245
-
246
-
247
-
248
-
249
-
250
-
251
-
252
-
253
-
254
-
255
-
256
-
257
-
258
-
259
-
260
-
261
-
262
-
263
-
264
-
265
-
266
-
267
-
268
-
269
-
270
-
271
-
272
-
273
-
274
-
275
-
276
-
277
-
278
-
279
-
280
-
281
-
282
-
283
-
284
-
285
-
286
-
287
-
288
-
289
-
290
-
291
-
292
-
293
-
294
-
295
-
296
-
297
-
298
-
299
-
300
-
301
-
302
-
303
-
304
-
305
-
306
-
307
-
308
-
309
-
310
-
311
-
312
-
313
 |
 |

88
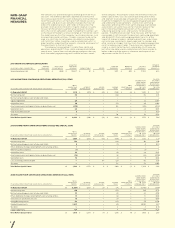
The company has presented organic revenue growth for fiscal
year 2011. The dierence between reported net revenue (the
most comparable GAAP measure) and organic revenue (the non-
GAAP measure) consists of the impact from foreign currency,
acquisitions and divestitures and other changes that may not
reflect the underlying results and trends of the business (for
example, revenue reclassifications). Organic revenue is a useful
measure of the company’s performance because it excludes
items that are not completely under management’s control, such
as the impact of foreign currency exchange, or that do not reflect
the underlying results of the company’s existing businesses, such
as acquisitions and divestitures. Organic revenue should not be
used as a substitute for net revenue calculated in accordance
with GAAP, but rather should be used in combination with it in
order to better understand the amounts, character and impact of
the adjustments to the GAAP results.
The company has presented its income from continuing
operations and diluted EPS from continuing operations before
special items. Special items include charges and gains that may
mask the underlying operating results and/or business trends
NON-GAAP
FINANCIAL
MEASURES
of the company. The company utilizes these financial measures
before special items to assess overall operating performance
and segment-level core operating performance, and to provide
insight to management in evaluating operating plan execution
and underlying market conditions. Income from continuing
operations and diluted EPS from continuing operations before
special items are useful measures for investors because they
permit more meaningful comparisons of the company’s
underlying operating results and business trends between
periods. The dierence between these measures and the most
comparable GAAP measures (income from continuing operations
and diluted EPS from continuing operations) consists of the
impact of charges and gains related to divestitures, acquisitions,
restructurings, impairments, legacy legal and tax charges, and
other income or charges that may mask the underlying operating
results and/or business trends. These measures should not be
used as a substitute for the most comparable GAAP measure,
but rather should be used in combination with them in order to
better understand the amounts, character and impact of any
adjustments to the GAAP results.
DILUTED
EPS FROM
CONTINUING
OPERATIONS
ATTRIBUTA BLE
TO TYCO
SHAREHOLDERS
INCOME FROM
CONTINUING
OPERATIONS
ATTRIBUTA BLE
TO TYCO
SHAREHOLDERS
NON-
CONTROLLING
INTEREST
INCOME
TAX ES
OTHER
EXPENSE, NET
INTEREST
EXPENSE, NET
TOTAL
OPERATING
INCOME
(IN US$ MILLIONS, EXCEPT PER SHARE DATA) (UNAUDITED)
As Reported (GAAP) $ (1,506) $ (257) $ (7) $ (71) $ (4) $ (1,845) $ (3.90)
Restructuring, net 199 — — (53) — 146 0.32
Restructuring charges in cost of sales and SG&A 33 — — (11) — 22 0.05
Other additional charges resulting from restructuring actions 15 — — (4) — 11 0.02
(Gains)/losses on divestitures, net 15 — — (3) — 12 0.03
Intangible impairments 64 — — (25) — 39 0.08
Goodwill impairments 2,641 — — (41) — 2,600 5.47
Tax items — — — 3 — 3 0.01
Legacy legal items 114 — — 4 — 118 0.25
Total Before Special Items $ 1,575 $ (257) $ (7) $ (201) $ (4) $ 1,106 $ 2.33
2009 INCOME FROM CONTINUING OPERATIONS BEFORE SPECIAL ITEMS
DILUTED
EPS FROM
CONTINUING
OPERATIONS
ATTRIBUTA BLE
TO TYCO
SHAREHOLDERS
INCOME FROM
CONTINUING
OPERATIONS
ATTRIBUTA BLE
TO TYCO
SHAREHOLDERS
NON-
CONTROLLING
INTEREST
INCOME
TAX ES
OTHER
EXPENSE, NET
INTEREST
EXPENSE, NET
TOTAL
OPERATING
INCOME
(IN US$ MILLIONS, EXCEPT PER SHARE DATA) (UNAUDITED)
As Reported (GAAP) $ 1,598 $ (253) $ (75) $ (138) $ (7) $ 1,125 $ 2.31
Restructuring, net 134 — — (42) — 92 0.19
Restructuring charges in cost of sales and SG&A 9 — — (3) — 6 0.01
Other additional charges resulting from restructuring actions 1 — — — — 1 —
ERISA insurance recovery (1) — — — — (1) —
Acquisition costs 35 — — (11) — 24 0.05
Asset impairments and (gains)/losses on divestitures, net (38) — — (4) — (42) (0.09)
Separation costs 10 — — (1) — 9 0.02
Loss on extinguishment of debt — — 87 (25) — 62 0.13
Tax items — — — 32 — 32 0.06
Total Before Special Items $ 1,748 $ (253) $ 12 $ (192) $ (7) $ 1,308 $ 2.68
2010 INCOME FROM CONTINUING OPERATIONS BEFORE SPECIAL ITEMS
DILUTED
EPS FROM
CONTINUING
OPERATIONS
ATTRIBUTA BLE
TO TYCO
SHAREHOLDERS
INCOME FROM
CONTINUING
OPERATIONS
ATTRIBUTA BLE
TO TYCO
SHAREHOLDERS
NON-
CONTROLLING
INTEREST
INCOME
TAX ES
OTHER
EXPENSE, NET
INTEREST
EXPENSE, NET
TOTAL
OPERATING
INCOME
(IN US$ MILLIONS, EXCEPT PER SHARE DATA) (UNAUDITED)
As Reported (GAAP) $ 2,119 $ (210) $ (16) $ (326) $ (2) $ 1,565 $ 3.27
Restructuring, net 86 — — (24) — 62 0.13
Restructuring charges in cost of sales and SG&A 1 — — — — 1 —
Legacy legal items 20 — — 1 — 21 0.04
Acquisition costs 39 — — (13) — 26 0.06
Asset impairments and (gains)/losses on divestitures, net (230) — — 68 — (162) (0.34)
Separation costs 24 — — — — 24 0.05
Note receivable write o 5 — — — — 5 0.01
Tax items — — — 10 — 10 0.02
Total Before Special Items $ 2,064 $ (210) $ (16) $ (284) $ (2) $ 1,552 $ 3.24
2011 INCOME FROM CONTINUING OPERATIONS BEFORE SPECIAL ITEMS
ORGANIC
REVENUE
GROWTH %
2011 NET
REVENUES
ORGANIC
REVENUE
FOREIGN
CURRENCY
BASE YEAR
ADJUSTMENTS
ADJUSTED
2010 BASE
REVENUE ACQUISITIONS OTHER
2010 NET
REVENUES
( IN US$ MILLIONS) (UNAUDITED)
Tyco International Ltd. $ 17,016 $ (959) $ 16,057 $ 61 $ 71 503 $ 663 $ 17,355 4.1%
2011 ORGANIC REVENUE RECONCILIATION