ADT 2011 Annual Report Download - page 150
Download and view the complete annual report
Please find page 150 of the 2011 ADT annual report below. You can navigate through the pages in the report by either clicking on the pages listed below, or by using the keyword search tool below to find specific information within the annual report.-
 1
1 -
2
-
3
-
4
-
5
-
6
-
7
-
8
-
9
-
10
-
11
-
12
-
13
-
14
-
15
-
16
-
17
-
18
-
19
-
20
-
21
-
22
-
23
-
24
-
25
-
26
-
27
-
28
-
29
-
30
-
31
-
32
-
33
-
34
-
35
-
36
-
37
-
38
-
39
-
40
-
41
-
42
-
43
-
44
-
45
-
46
-
47
-
48
-
49
-
50
-
51
-
52
-
53
-
54
-
55
-
56
-
57
-
58
-
59
-
60
-
61
-
62
-
63
-
64
-
65
-
66
-
67
-
68
-
69
-
70
-
71
-
72
-
73
-
74
-
75
-
76
-
77
-
78
-
79
-
80
-
81
-
82
-
83
-
84
-
85
-
86
-
87
-
88
-
89
-
90
-
91
-
92
-
93
-
94
-
95
-
96
-
97
-
98
-
99
-
100
-
101
-
102
-
103
-
104
-
105
-
106
-
107
-
108
-
109
-
110
-
111
-
112
-
113
-
114
-
115
-
116
-
117
-
118
-
119
-
120
-
121
-
122
-
123
-
124
-
125
-
126
-
127
-
128
-
129
-
130
-
131
-
132
-
133
-
134
-
135
-
136
-
137
-
138
-
139
-
 140
140 -
 141
141 -
 142
142 -
 143
143 -
 144
144 -
 145
145 -
 146
146 -
 147
147 -
 148
148 -
 149
149 -
 150
150 -
 151
151 -
 152
152 -
 153
153 -
 154
154 -
 155
155 -
 156
156 -
 157
157 -
 158
158 -
 159
159 -
 160
160 -
161
-
162
-
163
-
164
-
165
-
166
-
167
-
168
-
169
-
170
-
171
-
172
-
173
-
174
-
175
-
176
-
177
-
178
-
179
-
180
-
181
-
182
-
183
-
184
-
185
-
186
-
187
-
188
-
189
-
190
-
191
-
192
-
193
-
194
-
195
-
196
-
197
-
198
-
199
-
200
-
201
-
202
-
203
-
204
-
205
-
206
-
207
-
208
-
209
-
210
-
211
-
212
-
213
-
214
-
215
-
216
-
217
-
218
-
219
-
220
-
221
-
222
-
223
-
224
-
225
-
226
-
227
-
228
-
229
-
230
-
231
-
232
-
233
-
234
-
235
-
236
-
237
-
238
-
239
-
240
-
241
-
242
-
243
-
244
-
245
-
246
-
247
-
248
-
249
-
250
-
251
-
252
-
253
-
254
-
255
-
256
-
257
-
258
-
259
-
260
-
261
-
262
-
263
-
264
-
265
-
266
-
267
-
268
-
269
-
270
-
271
-
272
-
273
-
274
-
275
-
276
-
277
-
278
-
279
-
280
-
281
-
282
-
283
-
284
-
285
-
286
-
287
-
288
-
289
-
290
-
291
-
292
-
293
-
294
-
295
-
296
-
297
-
298
-
299
-
300
-
301
-
302
-
303
-
304
-
305
-
306
-
307
-
308
-
309
-
310
-
311
-
312
-
313
 |
 |

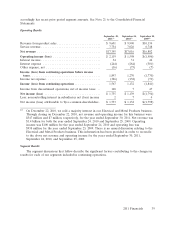
Operating income of $534 million increased $74 million, or 16.1%, for the year ended
September 30, 2011 as compared to the year ended September 24, 2010. Changes in foreign currency
exchange rates favorably impacted operating income by $15 million, or 3.3%. Other factors that
contributed to the net increase in operating income and operating margin were increased sales volume,
implementation of pricing actions to offset commodity inflationary pressures in the products business,
project selectivity in the systems installation business, and cost-containment initiatives. These increases
were partially offset by additional environmental remediation costs of $11 million, net of recoveries
related to an isolated site, and a $5 million decrease to operating income related to the deconsolidation
of a joint venture. Included in operating income for the prior year comparable period is a curtailment
gain of $8 million, which was recognized upon the freezing of certain defined benefit plans in the
United Kingdom. Included in operating income for the year ended September 30, 2011 was $38 million
of restructuring charges, net as compared to $42 million of restructuring charges, net for the year
ended September 24, 2010. Included in operating income for the year ended September 30, 2011 was
$29 million of losses on divestitures as compared to $2 million of losses on divestitures for the year
ended September 24, 2010.
Operating income increased $440 million during the year ended September 24, 2010 as compared
to the year ended September 25, 2009. Operating income during the year ended September 25, 2009
was negatively affected by a goodwill impairment charge of $420 million recorded at the EMEA Fire
and Life Safety reporting units. Additionally, operating income in 2010 was favorably impacted by
savings realized through cost containment actions, $14 million of favorable changes in foreign currency
exchange rates, and to a lesser extent, a curtailment gain of approximately $8 million recognized when
certain defined benefit pension plans were frozen in the United Kingdom. There were $42 million of
restructuring charges, net and a loss on divestiture of $2 million during the year ended September 24,
2010, compared with $62 million of restructuring charges, net and nil of divestiture charges incurred in
2009. Additionally, management estimates that $7 million of additional charges resulting from
restructuring actions were incurred during 2009. Operating income in 2009 was also unfavorably
affected by the decreased sales volume discussed above.
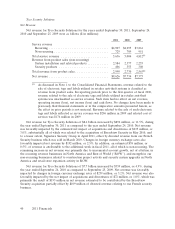
Tyco Flow Control
Net Revenue
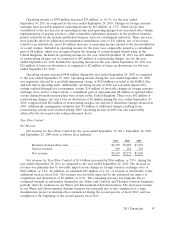
Net revenue for Tyco Flow Control for the years ended September 30, 2011, September 24, 2010,
and September 25, 2009 were as follows ($ in millions):
2011 2010 2009
Revenue from product sales ...................... $3,330 $3,089 $3,232
Service revenue ............................... 309 284 263
Net revenue .................................. $3,639 $3,373 $3,495
Net revenue for Tyco Flow Control of $3.6 billion increased by $266 million, or 7.9%, during the
year ended September 30, 2011 as compared to the year ended September 24, 2010. The increase in
revenue was primarily due to favorable impacts from changes in foreign currency exchange rates of
$183 million, or 5.4%. In addition, an estimated $45 million, or 1.3%, of revenue is attributable to the
additional week in fiscal 2011. Net revenue was favorably impacted by the estimated net impact of
acquisitions and divestitures of $7 million, or 0.2%. The remaining increase was primarily due to
continued strength in end-market demand in our Valves and Controls and Thermal Controls businesses
partially offset by weakness in our Water and Environmental Systems business. The decreased revenue
in our Water and Environmental Systems business was primarily due to the completion of a large
desalinization project in Australia that commenced during the second quarter of fiscal 2010, and was
completed at the beginning of the second quarter fiscal 2011.
2011 Financials 47