ADT 2011 Annual Report Download - page 288
Download and view the complete annual report
Please find page 288 of the 2011 ADT annual report below. You can navigate through the pages in the report by either clicking on the pages listed below, or by using the keyword search tool below to find specific information within the annual report.-
 1
1 -
2
-
3
-
4
-
5
-
6
-
7
-
8
-
9
-
10
-
11
-
12
-
13
-
14
-
15
-
16
-
17
-
18
-
19
-
20
-
21
-
22
-
23
-
24
-
25
-
26
-
27
-
28
-
29
-
30
-
31
-
32
-
33
-
34
-
35
-
36
-
37
-
38
-
39
-
40
-
41
-
42
-
43
-
44
-
45
-
46
-
47
-
48
-
49
-
50
-
51
-
52
-
53
-
54
-
55
-
56
-
57
-
58
-
59
-
60
-
61
-
62
-
63
-
64
-
65
-
66
-
67
-
68
-
69
-
70
-
71
-
72
-
73
-
74
-
75
-
76
-
77
-
78
-
79
-
80
-
81
-
82
-
83
-
84
-
85
-
86
-
87
-
88
-
89
-
90
-
91
-
92
-
93
-
94
-
95
-
96
-
97
-
98
-
99
-
100
-
101
-
102
-
103
-
104
-
105
-
106
-
107
-
108
-
109
-
110
-
111
-
112
-
113
-
114
-
115
-
116
-
117
-
118
-
119
-
120
-
121
-
122
-
123
-
124
-
125
-
126
-
127
-
128
-
129
-
130
-
131
-
132
-
133
-
134
-
135
-
136
-
137
-
138
-
139
-
140
-
141
-
142
-
143
-
144
-
145
-
146
-
147
-
148
-
149
-
150
-
151
-
152
-
153
-
154
-
155
-
156
-
157
-
158
-
159
-
160
-
161
-
162
-
163
-
164
-
165
-
166
-
167
-
168
-
169
-
170
-
171
-
172
-
173
-
174
-
175
-
176
-
177
-
178
-
179
-
180
-
181
-
182
-
183
-
184
-
185
-
186
-
187
-
188
-
189
-
190
-
191
-
192
-
193
-
194
-
195
-
196
-
197
-
198
-
199
-
200
-
201
-
202
-
203
-
204
-
205
-
206
-
207
-
208
-
209
-
210
-
211
-
212
-
213
-
214
-
215
-
216
-
217
-
218
-
219
-
220
-
221
-
222
-
223
-
224
-
225
-
226
-
227
-
228
-
229
-
230
-
231
-
232
-
233
-
234
-
235
-
236
-
237
-
238
-
239
-
240
-
241
-
242
-
243
-
244
-
245
-
246
-
247
-
248
-
249
-
250
-
251
-
252
-
253
-
254
-
255
-
256
-
257
-
258
-
259
-
260
-
261
-
262
-
263
-
264
-
265
-
266
-
267
-
268
-
269
-
270
-
271
-
272
-
273
-
274
-
275
-
276
-
277
-
 278
278 -
 279
279 -
 280
280 -
 281
281 -
 282
282 -
 283
283 -
 284
284 -
 285
285 -
 286
286 -
 287
287 -
 288
288 -
 289
289 -
 290
290 -
 291
291 -
 292
292 -
 293
293 -
 294
294 -
 295
295 -
 296
296 -
 297
297 -
 298
298 -
299
-
300
-
301
-
302
-
303
-
304
-
305
-
306
-
307
-
308
-
309
-
310
-
311
-
312
-
313
 |
 |

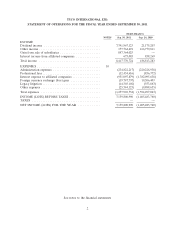
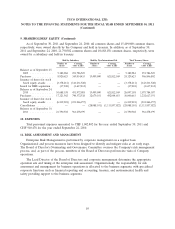
TYCO INTERNATIONAL LTD.
BALANCE SHEET AS OF SEPTEMBER 30, 2011
SWISS FRANCS
NOTES Sep. 30, 2011 Sep. 24, 2010
ASSETS
CURRENT ASSETS
Cash ........................................ 7,052 69,374
Accounts receivable from third parties ............... 19,670,364 66,189,648
Accounts receivable from affiliated companies .......... 989,807,437 1,076,161,978
Own shares ................................... — 621,812,369
Prepaid expenses ............................... 1,597,851 1,913,439
Total current assets ............................. 1,011,082,704 1,766,146,808
NON-CURRENT ASSETS
Non-current accounts receivable from third parties ...... 66,008,092 89,023,959
Investment in subsidiaries ........................ 8 40,697,829,174 43,725,457,996
Loans to affiliated companies ...................... 1,730,033,136 —
Total non-current assets .......................... 42,493,870,402 43,814,481,955
TOTAL ASSETS ............................... 43,504,953,106 45,580,628,763
LIABILITIES AND SHAREHOLDERS’ EQUITY
CURRENT LIABILITIES
Accounts payable ............................... 214,875 231,922
Accrued and other current liabilities ................. 289,109,294 190,660,464
Total current liabilities ........................... 289,324,169 190,892,386
NON-CURRENT LIABILITIES
Unrealized foreign currency translation gain ........... 2c 7,405,135,378 5,661,307,922
Non-current accounts payable to affiliated companies .... 3,070,038,368 10,441,157,603
Loans from affiliated companies .................... 19,176,802,756 21,064,643,171
Other non-current liabilities ....................... 358,374,894 403,815,129
Total non-current liabilities ........................ 30,010,351,396 37,570,923,825
SHAREHOLDERS’ EQUITY
Share capital .................................. 3,258,632,435 3,683,470,241
Contributed surplus ............................. 35,254,539,039 36,490,531,246
General reserve ................................ 817,677,442 817,677,442
Reserve for treasury shares ....................... 961,278,399 1,073,784,387
Accumulated deficit ............................. (34,246,650,764) (32,841,167,004)
Net income (loss) .............................. 7,159,800,990 (1,405,483,760)
Total shareholders’ equity ......................... 9 13,205,277,541 7,818,812,552
TOTAL LIABILITIES AND SHAREHOLDERS’
EQUITY ................................... 43,504,953,106 45,580,628,763
See notes to the financial statements
1