ADT 2011 Annual Report Download - page 84
Download and view the complete annual report
Please find page 84 of the 2011 ADT annual report below. You can navigate through the pages in the report by either clicking on the pages listed below, or by using the keyword search tool below to find specific information within the annual report.-
 1
1 -
2
-
3
-
4
-
5
-
6
-
7
-
8
-
9
-
10
-
11
-
12
-
13
-
14
-
15
-
16
-
17
-
18
-
19
-
20
-
21
-
22
-
23
-
24
-
25
-
26
-
27
-
28
-
29
-
30
-
31
-
32
-
33
-
34
-
35
-
36
-
37
-
38
-
39
-
40
-
41
-
42
-
43
-
44
-
45
-
46
-
47
-
48
-
49
-
50
-
51
-
52
-
53
-
54
-
55
-
56
-
57
-
58
-
59
-
60
-
61
-
62
-
63
-
64
-
65
-
66
-
67
-
68
-
69
-
70
-
71
-
72
-
73
-
 74
74 -
 75
75 -
 76
76 -
 77
77 -
 78
78 -
 79
79 -
 80
80 -
 81
81 -
 82
82 -
 83
83 -
 84
84 -
 85
85 -
 86
86 -
 87
87 -
 88
88 -
 89
89 -
 90
90 -
 91
91 -
 92
92 -
 93
93 -
 94
94 -
95
-
96
-
97
-
98
-
99
-
100
-
101
-
102
-
103
-
104
-
105
-
106
-
107
-
108
-
109
-
110
-
111
-
112
-
113
-
114
-
115
-
116
-
117
-
118
-
119
-
120
-
121
-
122
-
123
-
124
-
125
-
126
-
127
-
128
-
129
-
130
-
131
-
132
-
133
-
134
-
135
-
136
-
137
-
138
-
139
-
140
-
141
-
142
-
143
-
144
-
145
-
146
-
147
-
148
-
149
-
150
-
151
-
152
-
153
-
154
-
155
-
156
-
157
-
158
-
159
-
160
-
161
-
162
-
163
-
164
-
165
-
166
-
167
-
168
-
169
-
170
-
171
-
172
-
173
-
174
-
175
-
176
-
177
-
178
-
179
-
180
-
181
-
182
-
183
-
184
-
185
-
186
-
187
-
188
-
189
-
190
-
191
-
192
-
193
-
194
-
195
-
196
-
197
-
198
-
199
-
200
-
201
-
202
-
203
-
204
-
205
-
206
-
207
-
208
-
209
-
210
-
211
-
212
-
213
-
214
-
215
-
216
-
217
-
218
-
219
-
220
-
221
-
222
-
223
-
224
-
225
-
226
-
227
-
228
-
229
-
230
-
231
-
232
-
233
-
234
-
235
-
236
-
237
-
238
-
239
-
240
-
241
-
242
-
243
-
244
-
245
-
246
-
247
-
248
-
249
-
250
-
251
-
252
-
253
-
254
-
255
-
256
-
257
-
258
-
259
-
260
-
261
-
262
-
263
-
264
-
265
-
266
-
267
-
268
-
269
-
270
-
271
-
272
-
273
-
274
-
275
-
276
-
277
-
278
-
279
-
280
-
281
-
282
-
283
-
284
-
285
-
286
-
287
-
288
-
289
-
290
-
291
-
292
-
293
-
294
-
295
-
296
-
297
-
298
-
299
-
300
-
301
-
302
-
303
-
304
-
305
-
306
-
307
-
308
-
309
-
310
-
311
-
312
-
313
 |
 |

70 2012 Proxy Statement
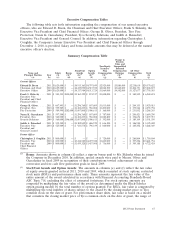
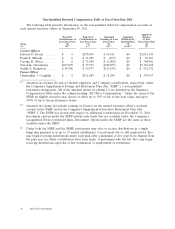
Grants of Plan-Based Awards Table
The following table summarizes cash-based and equity based awards for each of the Company’s named executive officers that were
granted during fiscal 2011 under the 2004 SIP.
All Other All Other Grant
Estimated Possible Payouts Estimated Possible Payouts Stock Option Date
Under Non-Equity Incentive Plan Under Equity Incentive Plan Awards: Awards: Exercise or Fair Value
Awards(1) Awards(2)
Number of Number of Base of Stock
Board or Target Shares Securities Price of and
Committee (Mid- of Stock Underlying Option Option
Grant Approval Threshold Target Maximum Threshold Point) Maximum or Units Options Awards Awards(3)
Name Date Date ($) ($) ($) (#) (#) (#) (#) (#) ($/Sh) ($)
(a) (b) (c) (d) (e) (f) (g) (h) (i) (j) (k) (l) (m)
Current Officers
Edward D. Breen ...... 12/8/2010 12/8/2010 $1,015,625 $2,031,250 $4,062,500
10/12/2010 10/12/2010 471,700 $37.29 $4,797,849
10/12/2010 10/12/2010 57,285 127,300 254,600 $4,913,163
Frank S. Sklarsky ...... 12/8/2010 12/8/2010 $ 350,000 $ 700,000 $1,400,000
12/9/2010 10/1/2010 72,500 $40.85 $ 874,517
12/9/2010 10/1/2010 9,700 $ 396,245
12/9/2010 10/1/2010 36,700 $1,499,195
12/9/2010 10/1/2010 9,100 $ 371,735
12/9/2010 10/1/2010 8,775 19,500 39,000 $ 896,147
George R. Oliver ...... 12/8/2010 12/8/2010 $ 305,000 $ 610,000 $1,220,000
10/12/2010 10/12/2010 79,400 $37.29 $ 807,609
10/12/2010 10/12/2010 10,700 $ 399,003
10/12/2010 10/12/2010 9,630 21,400 42,800 $ 897,757
Naren K. Gursahaney . . . 12/8/2010 12/8/2010 $ 305,000 $ 610,000 $1,220,000
10/12/2010 10/12/2010 79,400 $37.29 $ 807,609
10/12/2010 10/12/2010 10,700 $ 399,003
10/12/2010 10/12/2010 9,630 21,400 42,800 $ 897,757
Judith A. Reinsdorf .... 12/8/2010 12/8/2010 $ 214,000 $ 428,000 $ 856,000
10/12/2010 10/12/2010 67,500 $37.29 $ 686,570
10/12/2010 10/12/2010 9,100 $ 339,339
10/12/2010 10/12/2010 8,190 18,200 36,400 $ 763,513
Former Officer
Christopher J. Coughlin . . 12/8/2010 12/8/2010 $ 250,000 $ 500,000 $1,000,000
(1) Amounts reported in columns (d) through (f) represent potential annual performance bonuses that the named executive officers could have earned under the
Company’s annual incentive plan for fiscal 2011. The Board approved a maximum bonus payout of 0.50% of net income before special items for Mr. Breen,
subject to a cap of $5.0 million imposed by the 2004 SIP, and 0.25% for the other Senior Officers, subject to a cap of $2.5 million. The Compensation
Committee further established a maximum payout of 200% of target. Threshold amounts assume minimum performance levels are achieved with respect to
each performance measure.
(2) Amounts in (g) through (i) represent potential share payouts with respect to performance share awards that were made in connection with the fiscal year 2011
long-term compensation grant. Performance share units were granted to certain executive officers in October 2010 (December 2010 in the case of
Mr. Sklarsky) and vest at the end of the three-year performance period on September 27, 2013. The number of shares that will be paid out will depend on the
Company’s (i) three-year annualized total shareholder return over the performance period, as compared to the return for the S&P 500 Industrials Index and
(ii) achievement of cumulative earnings per share before special items over the performance period. Equity was granted to Mr. Sklarsky when he joined the
Company in December 2010. A portion of the award granted on December 8, 2010, consisting of (i) restricted stock units with a grant date fair value of
$1.5 million that vest in equal annual installments over a three year period and (ii) restricted stock units with a grant date fair value of $371,735 that vest on
the third anniversary of the grant date, were intended to compensate Mr. Sklarsky for equity and other benefits forfeited with his previous employer.
(3) Amounts in column (m) show the grant date fair value of the option awards and performance share awards granted to named executive officers. Amounts for
performance share awards represent the estimate of the aggregate compensation cost to be recognized over the three year performance period determined as
of the grant date under FASB ASC Topic 718, excluding the effect of estimated forfeitures. The actual number of shares that are paid out will depend on the
Company’s achievement of the performance metrics at the end of the performance period.