ADT 2011 Annual Report Download - page 264
Download and view the complete annual report
Please find page 264 of the 2011 ADT annual report below. You can navigate through the pages in the report by either clicking on the pages listed below, or by using the keyword search tool below to find specific information within the annual report.-
 1
1 -
2
-
3
-
4
-
5
-
6
-
7
-
8
-
9
-
10
-
11
-
12
-
13
-
14
-
15
-
16
-
17
-
18
-
19
-
20
-
21
-
22
-
23
-
24
-
25
-
26
-
27
-
28
-
29
-
30
-
31
-
32
-
33
-
34
-
35
-
36
-
37
-
38
-
39
-
40
-
41
-
42
-
43
-
44
-
45
-
46
-
47
-
48
-
49
-
50
-
51
-
52
-
53
-
54
-
55
-
56
-
57
-
58
-
59
-
60
-
61
-
62
-
63
-
64
-
65
-
66
-
67
-
68
-
69
-
70
-
71
-
72
-
73
-
74
-
75
-
76
-
77
-
78
-
79
-
80
-
81
-
82
-
83
-
84
-
85
-
86
-
87
-
88
-
89
-
90
-
91
-
92
-
93
-
94
-
95
-
96
-
97
-
98
-
99
-
100
-
101
-
102
-
103
-
104
-
105
-
106
-
107
-
108
-
109
-
110
-
111
-
112
-
113
-
114
-
115
-
116
-
117
-
118
-
119
-
120
-
121
-
122
-
123
-
124
-
125
-
126
-
127
-
128
-
129
-
130
-
131
-
132
-
133
-
134
-
135
-
136
-
137
-
138
-
139
-
140
-
141
-
142
-
143
-
144
-
145
-
146
-
147
-
148
-
149
-
150
-
151
-
152
-
153
-
154
-
155
-
156
-
157
-
158
-
159
-
160
-
161
-
162
-
163
-
164
-
165
-
166
-
167
-
168
-
169
-
170
-
171
-
172
-
173
-
174
-
175
-
176
-
177
-
178
-
179
-
180
-
181
-
182
-
183
-
184
-
185
-
186
-
187
-
188
-
189
-
190
-
191
-
192
-
193
-
194
-
195
-
196
-
197
-
198
-
199
-
200
-
201
-
202
-
203
-
204
-
205
-
206
-
207
-
208
-
209
-
210
-
211
-
212
-
213
-
214
-
215
-
216
-
217
-
218
-
219
-
220
-
221
-
222
-
223
-
224
-
225
-
226
-
227
-
228
-
229
-
230
-
231
-
232
-
233
-
234
-
235
-
236
-
237
-
238
-
239
-
240
-
241
-
242
-
243
-
244
-
245
-
246
-
247
-
248
-
249
-
250
-
251
-
252
-
253
-
 254
254 -
 255
255 -
 256
256 -
 257
257 -
 258
258 -
 259
259 -
 260
260 -
 261
261 -
 262
262 -
 263
263 -
 264
264 -
 265
265 -
 266
266 -
 267
267 -
 268
268 -
 269
269 -
 270
270 -
 271
271 -
 272
272 -
 273
273 -
 274
274 -
275
-
276
-
277
-
278
-
279
-
280
-
281
-
282
-
283
-
284
-
285
-
286
-
287
-
288
-
289
-
290
-
291
-
292
-
293
-
294
-
295
-
296
-
297
-
298
-
299
-
300
-
301
-
302
-
303
-
304
-
305
-
306
-
307
-
308
-
309
-
310
-
311
-
312
-
313
 |
 |

TYCO INTERNATIONAL LTD.
NOTES TO CONSOLIDATED FINANCIAL STATEMENTS (Continued)
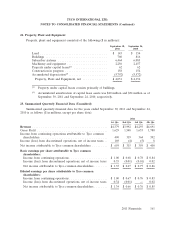
24. Property, Plant and Equipment
Property, plant and equipment consisted of the following ($ in millions):
September 30, September 24,
2011 2010
Land ...................................... $ 143 $ 154
Buildings ................................... 760 816
Subscriber systems ............................ 6,464 6,085
Machinery and equipment ....................... 2,256 2,457
Property under capital leases(1) ................... 62 62
Construction in progress ........................ 158 154
Accumulated depreciation(2) ...................... (5,792) (5,572)
Property, Plant and Equipment, net .............. $4,051 $ 4,156
(1) Property under capital leases consists primarily of buildings.
(2) Accumulated amortization of capital lease assets was $40 million and $34 million as of
September 30, 2011 and September 24, 2010, respectively.
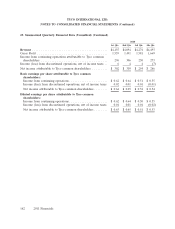
25. Summarized Quarterly Financial Data (Unaudited)
Summarized quarterly financial data for the years ended September 30, 2011 and September 24,
2010 is as follows ($ in millions, except per share data):
2011
1st Qtr. 2nd Qtr. 3rd Qtr. 4th Qtr.
Revenue ........................................... $4,379 $3,992 $4,293 $4,691
Gross Profit ........................................ 1,629 1,548 1,653 1,780
Income from continuing operations attributable to Tyco common
shareholders ...................................... 490 319 364 392
Income (loss) from discontinued operations, net of income taxes . . 169 (4) (5) 8
Net income attributable to Tyco common shareholders ......... $ 659 $ 315 $ 359 $ 400
Basic earnings per share attributable to Tyco common
shareholders:
Income from continuing operations ...................... $ 1.00 $ 0.68 $ 0.78 $ 0.84
Income (loss) from discontinued operations, net of income taxes 0.35 (0.01) (0.01) 0.02
Net income attributable to Tyco common shareholders ........ $ 1.35 $ 0.67 $ 0.77 $ 0.86
Diluted earnings per share attributable to Tyco common
shareholders:
Income from continuing operations ...................... $ 1.00 $ 0.67 $ 0.76 $ 0.83
Income (loss) from discontinued operations, net of income taxes 0.34 (0.01) — 0.02
Net income attributable to Tyco common shareholders ........ $ 1.34 $ 0.66 $ 0.76 $ 0.85
2011 Financials 161