ADT 2011 Annual Report Download - page 151
Download and view the complete annual report
Please find page 151 of the 2011 ADT annual report below. You can navigate through the pages in the report by either clicking on the pages listed below, or by using the keyword search tool below to find specific information within the annual report.-
 1
1 -
2
-
3
-
4
-
5
-
6
-
7
-
8
-
9
-
10
-
11
-
12
-
13
-
14
-
15
-
16
-
17
-
18
-
19
-
20
-
21
-
22
-
23
-
24
-
25
-
26
-
27
-
28
-
29
-
30
-
31
-
32
-
33
-
34
-
35
-
36
-
37
-
38
-
39
-
40
-
41
-
42
-
43
-
44
-
45
-
46
-
47
-
48
-
49
-
50
-
51
-
52
-
53
-
54
-
55
-
56
-
57
-
58
-
59
-
60
-
61
-
62
-
63
-
64
-
65
-
66
-
67
-
68
-
69
-
70
-
71
-
72
-
73
-
74
-
75
-
76
-
77
-
78
-
79
-
80
-
81
-
82
-
83
-
84
-
85
-
86
-
87
-
88
-
89
-
90
-
91
-
92
-
93
-
94
-
95
-
96
-
97
-
98
-
99
-
100
-
101
-
102
-
103
-
104
-
105
-
106
-
107
-
108
-
109
-
110
-
111
-
112
-
113
-
114
-
115
-
116
-
117
-
118
-
119
-
120
-
121
-
122
-
123
-
124
-
125
-
126
-
127
-
128
-
129
-
130
-
131
-
132
-
133
-
134
-
135
-
136
-
137
-
138
-
139
-
140
-
 141
141 -
 142
142 -
 143
143 -
 144
144 -
 145
145 -
 146
146 -
 147
147 -
 148
148 -
 149
149 -
 150
150 -
 151
151 -
 152
152 -
 153
153 -
 154
154 -
 155
155 -
 156
156 -
 157
157 -
 158
158 -
 159
159 -
 160
160 -
 161
161 -
162
-
163
-
164
-
165
-
166
-
167
-
168
-
169
-
170
-
171
-
172
-
173
-
174
-
175
-
176
-
177
-
178
-
179
-
180
-
181
-
182
-
183
-
184
-
185
-
186
-
187
-
188
-
189
-
190
-
191
-
192
-
193
-
194
-
195
-
196
-
197
-
198
-
199
-
200
-
201
-
202
-
203
-
204
-
205
-
206
-
207
-
208
-
209
-
210
-
211
-
212
-
213
-
214
-
215
-
216
-
217
-
218
-
219
-
220
-
221
-
222
-
223
-
224
-
225
-
226
-
227
-
228
-
229
-
230
-
231
-
232
-
233
-
234
-
235
-
236
-
237
-
238
-
239
-
240
-
241
-
242
-
243
-
244
-
245
-
246
-
247
-
248
-
249
-
250
-
251
-
252
-
253
-
254
-
255
-
256
-
257
-
258
-
259
-
260
-
261
-
262
-
263
-
264
-
265
-
266
-
267
-
268
-
269
-
270
-
271
-
272
-
273
-
274
-
275
-
276
-
277
-
278
-
279
-
280
-
281
-
282
-
283
-
284
-
285
-
286
-
287
-
288
-
289
-
290
-
291
-
292
-
293
-
294
-
295
-
296
-
297
-
298
-
299
-
300
-
301
-
302
-
303
-
304
-
305
-
306
-
307
-
308
-
309
-
310
-
311
-
312
-
313
 |
 |

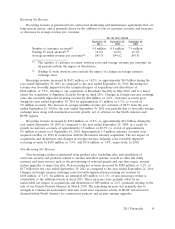
Net revenue for Tyco Flow Control of $3.4 billion decreased by $122 million, or 3.5%, during the
year ended year ended September 24, 2010 as compared to the year ended September 25, 2009. Net
revenue was favorably impacted by changes in foreign currency exchange rates of $218 million, or 6.2%,
as well as the net impact of acquisitions and divestitures of $10 million, or 0.3%. This was more than
offset by decreased revenues due to reduced volume in the Valves and Controls business driven by
decreased demand in end markets.
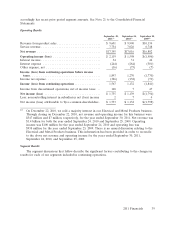
Operating Income and Operating Margin
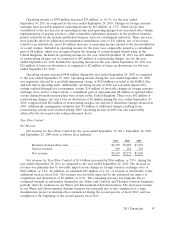
Operating income and operating margin for Tyco Flow Control for the years ended September 30,
2011, September 24, 2010, and September 25, 2009 were as follows ($ in millions):
2011 2010 2009
Operating income ................................ $413 $410 $496
Operating margin ................................ 11.3% 12.2% 14.2%
Operating income of $413 million increased by $3 million, or 0.7%, in the year ended
September 30, 2011 as compared to the year ended September 24, 2010. Operating income was
favorably impacted by changes in foreign currency exchange rates of $22 million, or 5.4%. The increase
in operating income was primarily due to continued strength in the Valves and Controls and Thermal
Controls businesses, which was more than offset by weakness in our Water and Environmental Systems
business. Restructuring charges, net were $11 million during the year ended September 30, 2011 as
compared to $25 million in the prior year. The year ended September 30, 2011 included a $6 million
gain on divestiture, compared to a $1 million gain on divestiture for the year ended September 24,
2010.
Operating income of $410 million decreased by $86 million, or 17.3%, during the year ended
September 24, 2010 as compared to the year ended September 25, 2009, primarily due to decreased
volume in our valves business and an expected loss related to completion of a long-term construction
project of approximately $18 million. These declines were partially offset by favorable changes in
foreign currency exchange rates of $31 million, or 6.3%. The decline in operating income was also
partially offset by savings realized through cost containment and restructuring actions. Operating
income was unfavorably impacted by $24 million of restructuring and divestiture charges, net during
both fiscal 2010 and fiscal 2009. Additionally, management estimated that $5 million of additional
charges resulting from restructuring actions were incurred during the year ended September 25, 2009.
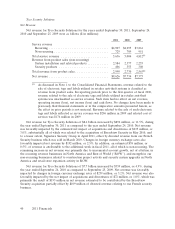
Corporate and Other
Corporate expense decreased $266 million, or 57.6%, to $196 million for the year ended
September 30, 2011 as compared to an expense of $462 million for the year ended September 24, 2010.
The decrease in corporate expense during the year ended September 30, 2011 is related to a
$253 million net gain on divestitures, primarily related to the divestiture of our Electrical and Metal
Products business, compared to a $4 million net loss on divestitures during the year ended
September 24, 2010. Corporate expense was also favorably impacted by cost containment initiatives
during the year ended September 30, 2011, as well as a lower net asbestos charge of $11 million
recorded in connection with the Company’s valuation of its asbestos-related liabilities during the year
ended September 30, 2011 compared to a $52 million, net asbestos charge recorded during the year
ended September 24, 2010. Corporate also recorded a $20 million charge in relation to a legacy legal
matter during the year ended September 30, 2011 as compared to nil during the year ended
September 24, 2010. Additionally, net restructuring charges and acquisition charges for the year ended
September 30, 2011 were $12 million and $1 million respectively, while the year ended September 24,
2010 included restructuring charges and acquisition charges of $1 million and $3 million, respectively.
The year ended September 30, 2011 included $24 million of separation costs primarily related to
48 2011 Financials