ADT 2011 Annual Report Download - page 244
Download and view the complete annual report
Please find page 244 of the 2011 ADT annual report below. You can navigate through the pages in the report by either clicking on the pages listed below, or by using the keyword search tool below to find specific information within the annual report.-
 1
1 -
2
-
3
-
4
-
5
-
6
-
7
-
8
-
9
-
10
-
11
-
12
-
13
-
14
-
15
-
16
-
17
-
18
-
19
-
20
-
21
-
22
-
23
-
24
-
25
-
26
-
27
-
28
-
29
-
30
-
31
-
32
-
33
-
34
-
35
-
36
-
37
-
38
-
39
-
40
-
41
-
42
-
43
-
44
-
45
-
46
-
47
-
48
-
49
-
50
-
51
-
52
-
53
-
54
-
55
-
56
-
57
-
58
-
59
-
60
-
61
-
62
-
63
-
64
-
65
-
66
-
67
-
68
-
69
-
70
-
71
-
72
-
73
-
74
-
75
-
76
-
77
-
78
-
79
-
80
-
81
-
82
-
83
-
84
-
85
-
86
-
87
-
88
-
89
-
90
-
91
-
92
-
93
-
94
-
95
-
96
-
97
-
98
-
99
-
100
-
101
-
102
-
103
-
104
-
105
-
106
-
107
-
108
-
109
-
110
-
111
-
112
-
113
-
114
-
115
-
116
-
117
-
118
-
119
-
120
-
121
-
122
-
123
-
124
-
125
-
126
-
127
-
128
-
129
-
130
-
131
-
132
-
133
-
134
-
135
-
136
-
137
-
138
-
139
-
140
-
141
-
142
-
143
-
144
-
145
-
146
-
147
-
148
-
149
-
150
-
151
-
152
-
153
-
154
-
155
-
156
-
157
-
158
-
159
-
160
-
161
-
162
-
163
-
164
-
165
-
166
-
167
-
168
-
169
-
170
-
171
-
172
-
173
-
174
-
175
-
176
-
177
-
178
-
179
-
180
-
181
-
182
-
183
-
184
-
185
-
186
-
187
-
188
-
189
-
190
-
191
-
192
-
193
-
194
-
195
-
196
-
197
-
198
-
199
-
200
-
201
-
202
-
203
-
204
-
205
-
206
-
207
-
208
-
209
-
210
-
211
-
212
-
213
-
214
-
215
-
216
-
217
-
218
-
219
-
220
-
221
-
222
-
223
-
224
-
225
-
226
-
227
-
228
-
229
-
230
-
231
-
232
-
233
-
 234
234 -
 235
235 -
 236
236 -
 237
237 -
 238
238 -
 239
239 -
 240
240 -
 241
241 -
 242
242 -
 243
243 -
 244
244 -
 245
245 -
 246
246 -
 247
247 -
 248
248 -
 249
249 -
 250
250 -
 251
251 -
 252
252 -
 253
253 -
 254
254 -
255
-
256
-
257
-
258
-
259
-
260
-
261
-
262
-
263
-
264
-
265
-
266
-
267
-
268
-
269
-
270
-
271
-
272
-
273
-
274
-
275
-
276
-
277
-
278
-
279
-
280
-
281
-
282
-
283
-
284
-
285
-
286
-
287
-
288
-
289
-
290
-
291
-
292
-
293
-
294
-
295
-
296
-
297
-
298
-
299
-
300
-
301
-
302
-
303
-
304
-
305
-
306
-
307
-
308
-
309
-
310
-
311
-
312
-
313
 |
 |

TYCO INTERNATIONAL LTD.
NOTES TO CONSOLIDATED FINANCIAL STATEMENTS (Continued)
16. Retirement Plans (Continued)
In determining the expected return on plan assets, the Company considers the relative weighting of
plan assets by asset class, historical performance of asset classes over long-term periods, asset class
performance expectations as well as current and future economic conditions.
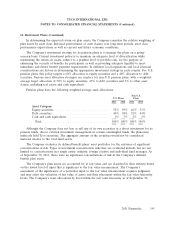
The Company’s investment strategy for its pension plans is to manage the plans on a going-
concern basis. Current investment policy is to maintain an adequate level of diversification while
maximizing the return on assets, subject to a prudent level of portfolio risk, for the purpose of
enhancing the security of benefits for participants as well as providing adequate liquidity to meet
immediate and future benefit payment requirements. In addition, local regulations and local financial
considerations are factors in determining the appropriate investment strategy in each country. For U.S.
pension plans, this policy targets a 60% allocation to equity securities and a 40% allocation to debt
securities. Various asset allocation strategies are in place for non-U.S. pension plans, with a weighted-
average target allocation of 50% to equity securities, 47% to debt securities and 3% to other asset
classes, including real estate and cash equivalents.
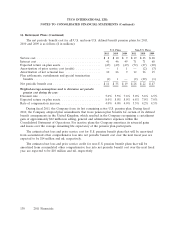
Pension plans have the following weighted-average asset allocations:
Non-U.S.
U.S. Plans Plans
2011 2010 2011 2010
Asset Category:
Equity securities ............................... 55% 59% 46% 53%
Debt securities ................................ 44% 38% 52% 44%
Cash and cash equivalents ........................ 1% 3% 2% 3%
Total ...................................... 100% 100% 100% 100%
Although the Company does not buy or sell any of its own securities as a direct investment for its
pension funds, due to external investment management in certain commingled funds, the plans may
indirectly hold Tyco securities. The aggregate amount of the securities would not be considered
material relative to the total fund assets.
The Company evaluates its defined benefit plans’ asset portfolios for the existence of significant
concentrations of risk. Types of investment concentration risks that are evaluated include, but are not
limited to, concentrations in a single entity, industry, foreign country and individual fund manager. As
of September 30, 2011, there were no significant concentrations of risk in the Company’s defined
benefit plan assets.
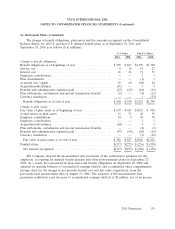
The Company’s plan assets are accounted for at fair value and are classified in their entirety based
on the lowest level of input that is significant to the fair value measurement. The Company’s
assessment of the significance of a particular input to the fair value measurement requires judgment,
and may affect the valuation of fair value of assets and their placement within the fair value hierarchy
levels. The Company’s asset allocations by level within the fair value hierarchy as of September 30,
2011 Financials 141