ADT 2011 Annual Report Download - page 134
Download and view the complete annual report
Please find page 134 of the 2011 ADT annual report below. You can navigate through the pages in the report by either clicking on the pages listed below, or by using the keyword search tool below to find specific information within the annual report.-
 1
1 -
2
-
3
-
4
-
5
-
6
-
7
-
8
-
9
-
10
-
11
-
12
-
13
-
14
-
15
-
16
-
17
-
18
-
19
-
20
-
21
-
22
-
23
-
24
-
25
-
26
-
27
-
28
-
29
-
30
-
31
-
32
-
33
-
34
-
35
-
36
-
37
-
38
-
39
-
40
-
41
-
42
-
43
-
44
-
45
-
46
-
47
-
48
-
49
-
50
-
51
-
52
-
53
-
54
-
55
-
56
-
57
-
58
-
59
-
60
-
61
-
62
-
63
-
64
-
65
-
66
-
67
-
68
-
69
-
70
-
71
-
72
-
73
-
74
-
75
-
76
-
77
-
78
-
79
-
80
-
81
-
82
-
83
-
84
-
85
-
86
-
87
-
88
-
89
-
90
-
91
-
92
-
93
-
94
-
95
-
96
-
97
-
98
-
99
-
100
-
101
-
102
-
103
-
104
-
105
-
106
-
107
-
108
-
109
-
110
-
111
-
112
-
113
-
114
-
115
-
116
-
117
-
118
-
119
-
120
-
121
-
122
-
123
-
 124
124 -
 125
125 -
 126
126 -
 127
127 -
 128
128 -
 129
129 -
 130
130 -
 131
131 -
 132
132 -
 133
133 -
 134
134 -
 135
135 -
 136
136 -
 137
137 -
 138
138 -
 139
139 -
 140
140 -
 141
141 -
 142
142 -
 143
143 -
 144
144 -
145
-
146
-
147
-
148
-
149
-
150
-
151
-
152
-
153
-
154
-
155
-
156
-
157
-
158
-
159
-
160
-
161
-
162
-
163
-
164
-
165
-
166
-
167
-
168
-
169
-
170
-
171
-
172
-
173
-
174
-
175
-
176
-
177
-
178
-
179
-
180
-
181
-
182
-
183
-
184
-
185
-
186
-
187
-
188
-
189
-
190
-
191
-
192
-
193
-
194
-
195
-
196
-
197
-
198
-
199
-
200
-
201
-
202
-
203
-
204
-
205
-
206
-
207
-
208
-
209
-
210
-
211
-
212
-
213
-
214
-
215
-
216
-
217
-
218
-
219
-
220
-
221
-
222
-
223
-
224
-
225
-
226
-
227
-
228
-
229
-
230
-
231
-
232
-
233
-
234
-
235
-
236
-
237
-
238
-
239
-
240
-
241
-
242
-
243
-
244
-
245
-
246
-
247
-
248
-
249
-
250
-
251
-
252
-
253
-
254
-
255
-
256
-
257
-
258
-
259
-
260
-
261
-
262
-
263
-
264
-
265
-
266
-
267
-
268
-
269
-
270
-
271
-
272
-
273
-
274
-
275
-
276
-
277
-
278
-
279
-
280
-
281
-
282
-
283
-
284
-
285
-
286
-
287
-
288
-
289
-
290
-
291
-
292
-
293
-
294
-
295
-
296
-
297
-
298
-
299
-
300
-
301
-
302
-
303
-
304
-
305
-
306
-
307
-
308
-
309
-
310
-
311
-
312
-
313
 |
 |

28NOV201112231304
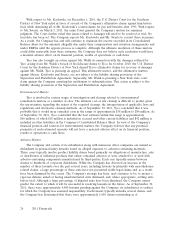
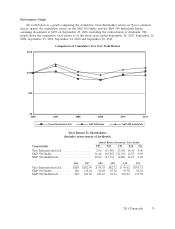
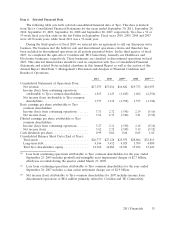
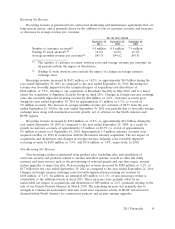
Performance Graph
Set forth below is a graph comparing the cumulative total shareholder return on Tyco’s common
shares against the cumulative return on the S&P 500 Index and the S&P 500 Industrials Index,
assuming investment of $100 on September 29, 2006, including the reinvestment of dividends. The
graph shows the cumulative total return as of the fiscal years ended September 28, 2007, September 26,
2008, September 25, 2009, September 24, 2010 and September 30, 2011.
Comparison of Cumulative Five Year Total Return
$0
$50
$100
$150
2006 2007 2008 2009 20112010
S&P 500 Industrials
S&P 500 Index
Tyco International Ltd.
Total Return To Shareholders
(Includes reinvestment of dividends)
Annual Return Percentage Years Ended
Company/Index 9/07 9/08 9/09 9/10 9/11
Tyco International Ltd. ................ 2.96 (17.08) (3.58) 16.16 8.06
S&P 500 Index ...................... 16.44 (18.85) (11.56) 12.23 0.49
S&P 500 Industrials ................... 20.96 (15.16) (8.00) 14.01 4.02
9/06 9/07 9/08 9/09 9/10 9/11
Tyco International Ltd. .... $100 $102.96 $ 85.38 $82.32 $ 95.62 $103.33
S&P 500 Index .......... 100 116.44 94.49 83.56 93.78 94.23
S&P 500 Industrials ...... 100 120.96 102.63 94.41 107.64 111.96
2011 Financials 31