ADT 2011 Annual Report Download - page 222
Download and view the complete annual report
Please find page 222 of the 2011 ADT annual report below. You can navigate through the pages in the report by either clicking on the pages listed below, or by using the keyword search tool below to find specific information within the annual report.-
 1
1 -
2
-
3
-
4
-
5
-
6
-
7
-
8
-
9
-
10
-
11
-
12
-
13
-
14
-
15
-
16
-
17
-
18
-
19
-
20
-
21
-
22
-
23
-
24
-
25
-
26
-
27
-
28
-
29
-
30
-
31
-
32
-
33
-
34
-
35
-
36
-
37
-
38
-
39
-
40
-
41
-
42
-
43
-
44
-
45
-
46
-
47
-
48
-
49
-
50
-
51
-
52
-
53
-
54
-
55
-
56
-
57
-
58
-
59
-
60
-
61
-
62
-
63
-
64
-
65
-
66
-
67
-
68
-
69
-
70
-
71
-
72
-
73
-
74
-
75
-
76
-
77
-
78
-
79
-
80
-
81
-
82
-
83
-
84
-
85
-
86
-
87
-
88
-
89
-
90
-
91
-
92
-
93
-
94
-
95
-
96
-
97
-
98
-
99
-
100
-
101
-
102
-
103
-
104
-
105
-
106
-
107
-
108
-
109
-
110
-
111
-
112
-
113
-
114
-
115
-
116
-
117
-
118
-
119
-
120
-
121
-
122
-
123
-
124
-
125
-
126
-
127
-
128
-
129
-
130
-
131
-
132
-
133
-
134
-
135
-
136
-
137
-
138
-
139
-
140
-
141
-
142
-
143
-
144
-
145
-
146
-
147
-
148
-
149
-
150
-
151
-
152
-
153
-
154
-
155
-
156
-
157
-
158
-
159
-
160
-
161
-
162
-
163
-
164
-
165
-
166
-
167
-
168
-
169
-
170
-
171
-
172
-
173
-
174
-
175
-
176
-
177
-
178
-
179
-
180
-
181
-
182
-
183
-
184
-
185
-
186
-
187
-
188
-
189
-
190
-
191
-
192
-
193
-
194
-
195
-
196
-
197
-
198
-
199
-
200
-
201
-
202
-
203
-
204
-
205
-
206
-
207
-
208
-
209
-
210
-
211
-
 212
212 -
 213
213 -
 214
214 -
 215
215 -
 216
216 -
 217
217 -
 218
218 -
 219
219 -
 220
220 -
 221
221 -
 222
222 -
 223
223 -
 224
224 -
 225
225 -
 226
226 -
 227
227 -
 228
228 -
 229
229 -
 230
230 -
 231
231 -
 232
232 -
233
-
234
-
235
-
236
-
237
-
238
-
239
-
240
-
241
-
242
-
243
-
244
-
245
-
246
-
247
-
248
-
249
-
250
-
251
-
252
-
253
-
254
-
255
-
256
-
257
-
258
-
259
-
260
-
261
-
262
-
263
-
264
-
265
-
266
-
267
-
268
-
269
-
270
-
271
-
272
-
273
-
274
-
275
-
276
-
277
-
278
-
279
-
280
-
281
-
282
-
283
-
284
-
285
-
286
-
287
-
288
-
289
-
290
-
291
-
292
-
293
-
294
-
295
-
296
-
297
-
298
-
299
-
300
-
301
-
302
-
303
-
304
-
305
-
306
-
307
-
308
-
309
-
310
-
311
-
312
-
313
 |
 |

TYCO INTERNATIONAL LTD.
NOTES TO CONSOLIDATED FINANCIAL STATEMENTS (Continued)
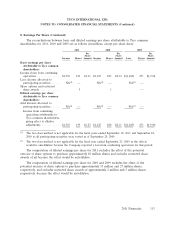
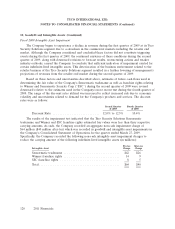
10. Goodwill and Intangible Assets (Continued)
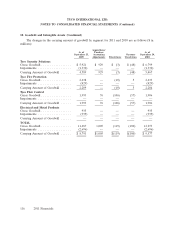
2009. Specifically, the Company recorded the following non-cash goodwill impairment charges at the
following reporting units ($ in millions):
Pre-tax After-tax
Reporting Unit Charge Charge
EMEA Fire ........................................ $ 180 $ 179
EMEA Security ..................................... 613 610
Electrical and Metal Products ........................... 935 915
ACVS ............................................ 327 321
Life Safety ......................................... 240 236
SRS.............................................. 346 340
Total ............................................. $2,641 $2,601
Fiscal 2011 and 2010 Intangible Assets
Indefinite lived intangible assets consisting primarily of trade names are tested for impairment
using the relief from royalty method. There were no indefinite lived intangible asset impairments as a
result of performing the Company’s 2011 and 2010 annual impairment tests.
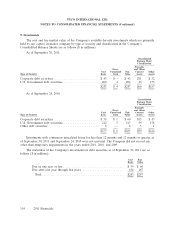
The following table sets forth the gross carrying amount and accumulated amortization of the
Company’s intangible assets as of September 30, 2011 and September 24, 2010 ($ in millions):
September 30, 2011 September 24, 2010
Weighted- Weighted-
Gross Average Gross Average
Carrying Accumulated Amortization Carrying Accumulated Amortization
Amount Amortization Period Amount Amortization Period
Amortizable:
Contracts and related
customer relationships .... $8,225 $5,077 14 years $7,664 $4,606 14 years
Intellectual property ....... 571 483 19 years 546 477 20 years
Other ................. 116 22 10 years 29 15 8 years
Total .................. $8,912 $5,582 14 years $8,239 $5,098 14 years
Non-Amortizable:
Intellectual property ....... $ 212 $ 213
Other ................. 86 92
Total .................. $ 298 $ 305
Intangible asset amortization expense for 2011, 2010 and 2009 was $623 million, $549 million and
$516 million, respectively.
The estimated aggregate amortization expense on intangible assets is expected to be approximately
$600 million for 2012, $500 million for 2013, $425 million for 2014, $375 million for 2015 and
$325 million for 2016.
2011 Financials 119