ADT 2011 Annual Report Download - page 68
Download and view the complete annual report
Please find page 68 of the 2011 ADT annual report below. You can navigate through the pages in the report by either clicking on the pages listed below, or by using the keyword search tool below to find specific information within the annual report.-
 1
1 -
2
-
3
-
4
-
5
-
6
-
7
-
8
-
9
-
10
-
11
-
12
-
13
-
14
-
15
-
16
-
17
-
18
-
19
-
20
-
21
-
22
-
23
-
24
-
25
-
26
-
27
-
28
-
29
-
30
-
31
-
32
-
33
-
34
-
35
-
36
-
37
-
38
-
39
-
40
-
41
-
42
-
43
-
44
-
45
-
46
-
47
-
48
-
49
-
50
-
51
-
52
-
53
-
54
-
55
-
56
-
57
-
 58
58 -
 59
59 -
 60
60 -
 61
61 -
 62
62 -
 63
63 -
 64
64 -
 65
65 -
 66
66 -
 67
67 -
 68
68 -
 69
69 -
 70
70 -
 71
71 -
 72
72 -
 73
73 -
 74
74 -
 75
75 -
 76
76 -
 77
77 -
 78
78 -
79
-
80
-
81
-
82
-
83
-
84
-
85
-
86
-
87
-
88
-
89
-
90
-
91
-
92
-
93
-
94
-
95
-
96
-
97
-
98
-
99
-
100
-
101
-
102
-
103
-
104
-
105
-
106
-
107
-
108
-
109
-
110
-
111
-
112
-
113
-
114
-
115
-
116
-
117
-
118
-
119
-
120
-
121
-
122
-
123
-
124
-
125
-
126
-
127
-
128
-
129
-
130
-
131
-
132
-
133
-
134
-
135
-
136
-
137
-
138
-
139
-
140
-
141
-
142
-
143
-
144
-
145
-
146
-
147
-
148
-
149
-
150
-
151
-
152
-
153
-
154
-
155
-
156
-
157
-
158
-
159
-
160
-
161
-
162
-
163
-
164
-
165
-
166
-
167
-
168
-
169
-
170
-
171
-
172
-
173
-
174
-
175
-
176
-
177
-
178
-
179
-
180
-
181
-
182
-
183
-
184
-
185
-
186
-
187
-
188
-
189
-
190
-
191
-
192
-
193
-
194
-
195
-
196
-
197
-
198
-
199
-
200
-
201
-
202
-
203
-
204
-
205
-
206
-
207
-
208
-
209
-
210
-
211
-
212
-
213
-
214
-
215
-
216
-
217
-
218
-
219
-
220
-
221
-
222
-
223
-
224
-
225
-
226
-
227
-
228
-
229
-
230
-
231
-
232
-
233
-
234
-
235
-
236
-
237
-
238
-
239
-
240
-
241
-
242
-
243
-
244
-
245
-
246
-
247
-
248
-
249
-
250
-
251
-
252
-
253
-
254
-
255
-
256
-
257
-
258
-
259
-
260
-
261
-
262
-
263
-
264
-
265
-
266
-
267
-
268
-
269
-
270
-
271
-
272
-
273
-
274
-
275
-
276
-
277
-
278
-
279
-
280
-
281
-
282
-
283
-
284
-
285
-
286
-
287
-
288
-
289
-
290
-
291
-
292
-
293
-
294
-
295
-
296
-
297
-
298
-
299
-
300
-
301
-
302
-
303
-
304
-
305
-
306
-
307
-
308
-
309
-
310
-
311
-
312
-
313
 |
 |

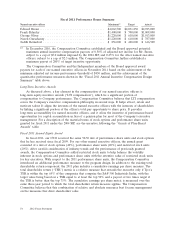
Fiscal 2011 Performance Bonus Summary
Named executive officer Maximum(1) Target Actual
Edward Breen ..................................... $4,062,500 $2,031,250 $2,925,000
Frank Sklarsky .................................... $1,400,000 $ 700,000 $1,008,000
George Oliver ..................................... $1,220,000 $ 610,000 $1,013,000
Naren Gursahaney .................................. $1,220,000 $ 610,000 $ 787,000
Judith Reinsdorf ................................... $ 856,000 $ 428,000 $ 616,500
(1) In December 2010, the Compensation Committee established and the Board approved potential
maximum annual incentive compensation payouts of 0.50% of adjusted net income for Mr. Breen,
subject to a cap of $5.0 million imposed by the 2004 SIP, and 0.25% for the other named executive
officers, subject to a cap of $2.5 million. The Compensation Committee further established a
maximum payout of 200% of target incentive opportunity.
The Compensation Committee and the Independent members of the Board approved award
payouts for each of our named executive officers in November 2011 based on the achievement of the
minimum adjusted net income performance threshold of $450 million, and the achievement of the
quantitative performance measures shown in the ‘‘Fiscal 2011 Annual Incentive Compensation Design
Summary’’ table above.
Long-Term Incentive Awards
As discussed above, a key element in the compensation of our named executive officers is
long-term equity incentive awards (‘‘LTI compensation’’), which tie a significant portion of
compensation to Company performance. The Compensation Committee believes that LTI compensation
serves the Company’s executive compensation philosophy in several ways. It helps attract, retain and
motivate talent. It aligns the interests of the named executive officers with the interests of shareholders
by linking a significant portion of the officer’s total pay opportunity to share price. It provides
long-term accountability for named executive officers, and it offers the incentive of performance-based
opportunities for capital accumulation in lieu of a pension plan for most of the Company’s executive
management. For a description of the material terms of stock options and performance share units
granted for fiscal 2011 under the 2004 SIP, see the narrative following the ‘‘Grants of Plan-Based
Awards’’ table.
Fiscal 2011 Annual Equity Award
In fiscal 2011, our CEO received the same 50-50 mix of performance share units and stock options
that he has received since fiscal 2009. For our other named executive officers, the annual grant
consisted of a mix of stock options (40%), performance share units (40%) and restricted stock units
(20%). After careful consideration of industry trends and the performance of previously granted
awards, the Compensation Committee added restricted stock units to help balance the volatility
inherent in stock options and performance share units with the retentive value of restricted stock units
for key executives. With respect to the 2011 performance share units, the Compensation Committee
introduced an additional performance measure to the program design. In addition to the existing total
shareholder return component, the 2011 plan includes a cumulative earnings per share measure. The
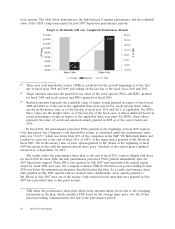
total shareholder return (‘‘TSR’’) metric is a relative measure that rewards the executive only if Tyco’s
TSR is within the top 65% of the companies that comprise the S&P 500 Industrials Index, with the
target value being based on a TSR equal to at least the top 50% and a payout of two times target if
the TSR is better than the top 75%. The cumulative earnings per share metric is measured over the
same three-year period to which the total shareholder return measure applies. The Compensation
Committee believes that this combination of relative and absolute measures best focuses management
on the measures that drive shareholder value.
54 2012 Proxy Statement