ADT 2011 Annual Report Download - page 257
Download and view the complete annual report
Please find page 257 of the 2011 ADT annual report below. You can navigate through the pages in the report by either clicking on the pages listed below, or by using the keyword search tool below to find specific information within the annual report.-
 1
1 -
2
-
3
-
4
-
5
-
6
-
7
-
8
-
9
-
10
-
11
-
12
-
13
-
14
-
15
-
16
-
17
-
18
-
19
-
20
-
21
-
22
-
23
-
24
-
25
-
26
-
27
-
28
-
29
-
30
-
31
-
32
-
33
-
34
-
35
-
36
-
37
-
38
-
39
-
40
-
41
-
42
-
43
-
44
-
45
-
46
-
47
-
48
-
49
-
50
-
51
-
52
-
53
-
54
-
55
-
56
-
57
-
58
-
59
-
60
-
61
-
62
-
63
-
64
-
65
-
66
-
67
-
68
-
69
-
70
-
71
-
72
-
73
-
74
-
75
-
76
-
77
-
78
-
79
-
80
-
81
-
82
-
83
-
84
-
85
-
86
-
87
-
88
-
89
-
90
-
91
-
92
-
93
-
94
-
95
-
96
-
97
-
98
-
99
-
100
-
101
-
102
-
103
-
104
-
105
-
106
-
107
-
108
-
109
-
110
-
111
-
112
-
113
-
114
-
115
-
116
-
117
-
118
-
119
-
120
-
121
-
122
-
123
-
124
-
125
-
126
-
127
-
128
-
129
-
130
-
131
-
132
-
133
-
134
-
135
-
136
-
137
-
138
-
139
-
140
-
141
-
142
-
143
-
144
-
145
-
146
-
147
-
148
-
149
-
150
-
151
-
152
-
153
-
154
-
155
-
156
-
157
-
158
-
159
-
160
-
161
-
162
-
163
-
164
-
165
-
166
-
167
-
168
-
169
-
170
-
171
-
172
-
173
-
174
-
175
-
176
-
177
-
178
-
179
-
180
-
181
-
182
-
183
-
184
-
185
-
186
-
187
-
188
-
189
-
190
-
191
-
192
-
193
-
194
-
195
-
196
-
197
-
198
-
199
-
200
-
201
-
202
-
203
-
204
-
205
-
206
-
207
-
208
-
209
-
210
-
211
-
212
-
213
-
214
-
215
-
216
-
217
-
218
-
219
-
220
-
221
-
222
-
223
-
224
-
225
-
226
-
227
-
228
-
229
-
230
-
231
-
232
-
233
-
234
-
235
-
236
-
237
-
238
-
239
-
240
-
241
-
242
-
243
-
244
-
245
-
246
-
 247
247 -
 248
248 -
 249
249 -
 250
250 -
 251
251 -
 252
252 -
 253
253 -
 254
254 -
 255
255 -
 256
256 -
 257
257 -
 258
258 -
 259
259 -
 260
260 -
 261
261 -
 262
262 -
 263
263 -
 264
264 -
 265
265 -
 266
266 -
 267
267 -
268
-
269
-
270
-
271
-
272
-
273
-
274
-
275
-
276
-
277
-
278
-
279
-
280
-
281
-
282
-
283
-
284
-
285
-
286
-
287
-
288
-
289
-
290
-
291
-
292
-
293
-
294
-
295
-
296
-
297
-
298
-
299
-
300
-
301
-
302
-
303
-
304
-
305
-
306
-
307
-
308
-
309
-
310
-
311
-
312
-
313
 |
 |

TYCO INTERNATIONAL LTD.
NOTES TO CONSOLIDATED FINANCIAL STATEMENTS (Continued)
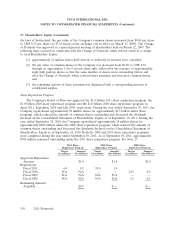
18. Share Plans (Continued)
The fair market value of restricted awards, both time vesting and those subject to specific
performance criteria, are expensed over the period of vesting. Restricted share awards that vest based
upon passage of time generally vest over a period of four years. The fair value of restricted share
awards is determined based on the closing market price of the Company’s shares on the grant date.
Restricted share awards that vest dependent upon attainment of various levels of performance that
equal or exceed targeted levels generally vest in their entirety three years from the grant date. The fair
value of performance share awards is determined based on the Monte Carlo valuation model. The
compensation expense recognized for restricted share awards is net of estimated forfeitures.
The Company generally grants restricted stock units. Recipients of restricted stock units have no
voting rights and receive dividend equivalent units (‘‘DEUs’’). Recipients of performance shares have
no voting rights and may receive DEUs depending on the terms of the grant.
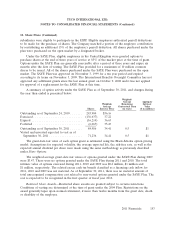
A summary of the activity of the Company’s restricted share awards including performance shares
as of September 30, 2011 and changes during the year then ended is presented in the tables below:
Weighted-Average
Grant-Date
Non-vested Restricted Share Awards Shares Fair Value
Non-vested as of September 24, 2010 .............. 3,671,026 $35.76
Granted ................................... 1,687,172 37.90
Vested .................................... (1,646,714) 40.10
Forfeited .................................. (408,172) 35.36
Non-vested as of September 30, 2011 .............. 3,303,312 34.78
The weighted-average grant-date fair value of restricted share awards granted during 2011, 2010
and 2009 was $37.90, $34.23 and, $28.56, respectively. The total fair value of restricted share awards
vested during 2011, 2010 and 2009 was $62 million, $54 million and $74 million, respectively.
Weighted-Average
Grant-Date
Non-vested Performance Share Awards Shares Fair Value
Non-vested as of September 24, 2010 .............. 1,729,152 $33.57
Granted .................................... 582,859 41.37
Forfeited ................................... (76,413) 35.55
Non-vested as of September 30, 2011 .............. 2,235,598 35.50
The weighted-average grant-date fair value of performance share awards granted during 2011, 2010
and 2009 was $41.37, $40.27 and $27.84, respectively. No performance shares vested during 2011, 2010
and 2009.
As of September 30, 2011, there was $84 million of total unrecognized compensation cost related
to both non-vested restricted share awards and performance shares. The cost is expected to be
recognized over a weighted-average period of 2.2 fiscal years.
154 2011 Financials