ADT 2011 Annual Report Download - page 272
Download and view the complete annual report
Please find page 272 of the 2011 ADT annual report below. You can navigate through the pages in the report by either clicking on the pages listed below, or by using the keyword search tool below to find specific information within the annual report.-
 1
1 -
2
-
3
-
4
-
5
-
6
-
7
-
8
-
9
-
10
-
11
-
12
-
13
-
14
-
15
-
16
-
17
-
18
-
19
-
20
-
21
-
22
-
23
-
24
-
25
-
26
-
27
-
28
-
29
-
30
-
31
-
32
-
33
-
34
-
35
-
36
-
37
-
38
-
39
-
40
-
41
-
42
-
43
-
44
-
45
-
46
-
47
-
48
-
49
-
50
-
51
-
52
-
53
-
54
-
55
-
56
-
57
-
58
-
59
-
60
-
61
-
62
-
63
-
64
-
65
-
66
-
67
-
68
-
69
-
70
-
71
-
72
-
73
-
74
-
75
-
76
-
77
-
78
-
79
-
80
-
81
-
82
-
83
-
84
-
85
-
86
-
87
-
88
-
89
-
90
-
91
-
92
-
93
-
94
-
95
-
96
-
97
-
98
-
99
-
100
-
101
-
102
-
103
-
104
-
105
-
106
-
107
-
108
-
109
-
110
-
111
-
112
-
113
-
114
-
115
-
116
-
117
-
118
-
119
-
120
-
121
-
122
-
123
-
124
-
125
-
126
-
127
-
128
-
129
-
130
-
131
-
132
-
133
-
134
-
135
-
136
-
137
-
138
-
139
-
140
-
141
-
142
-
143
-
144
-
145
-
146
-
147
-
148
-
149
-
150
-
151
-
152
-
153
-
154
-
155
-
156
-
157
-
158
-
159
-
160
-
161
-
162
-
163
-
164
-
165
-
166
-
167
-
168
-
169
-
170
-
171
-
172
-
173
-
174
-
175
-
176
-
177
-
178
-
179
-
180
-
181
-
182
-
183
-
184
-
185
-
186
-
187
-
188
-
189
-
190
-
191
-
192
-
193
-
194
-
195
-
196
-
197
-
198
-
199
-
200
-
201
-
202
-
203
-
204
-
205
-
206
-
207
-
208
-
209
-
210
-
211
-
212
-
213
-
214
-
215
-
216
-
217
-
218
-
219
-
220
-
221
-
222
-
223
-
224
-
225
-
226
-
227
-
228
-
229
-
230
-
231
-
232
-
233
-
234
-
235
-
236
-
237
-
238
-
239
-
240
-
241
-
242
-
243
-
244
-
245
-
246
-
247
-
248
-
249
-
250
-
251
-
252
-
253
-
254
-
255
-
256
-
257
-
258
-
259
-
260
-
261
-
 262
262 -
 263
263 -
 264
264 -
 265
265 -
 266
266 -
 267
267 -
 268
268 -
 269
269 -
 270
270 -
 271
271 -
 272
272 -
 273
273 -
 274
274 -
 275
275 -
 276
276 -
 277
277 -
 278
278 -
 279
279 -
 280
280 -
 281
281 -
 282
282 -
283
-
284
-
285
-
286
-
287
-
288
-
289
-
290
-
291
-
292
-
293
-
294
-
295
-
296
-
297
-
298
-
299
-
300
-
301
-
302
-
303
-
304
-
305
-
306
-
307
-
308
-
309
-
310
-
311
-
312
-
313
 |
 |

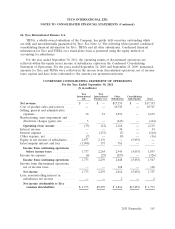
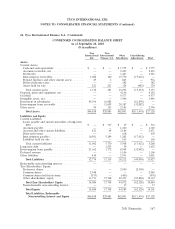
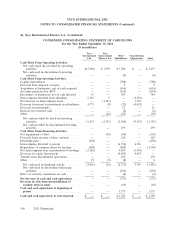
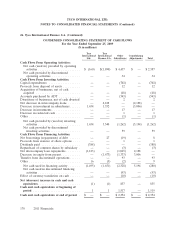
TYCO INTERNATIONAL LTD.
NOTES TO CONSOLIDATED FINANCIAL STATEMENTS (Continued)
26. Tyco International Finance S.A. (Continued)
CONDENSED CONSOLIDATING STATEMENT OF CASH FLOWS
For the Year Ended September 24, 2010
($ in millions)
Tyco Tyco
International International Other Consolidating
Ltd. Finance S.A. Subsidiaries Adjustments Total
Cash Flows From Operating Activities:
Net cash (used in) provided by operating
activities ......................... $ (325) $(172) $ 3,127 $ — $ 2,630
Net cash provided by discontinued operating
activities ......................... — — 27 — 27
Cash Flows From Investing Activities:
Capital expenditures .................... — — (718) — (718)
Proceeds from disposal of assets ............ — — 29 — 29
Acquisition of businesses, net of cash acquired . — — (600) — (600)
Accounts purchased by ADT .............. — — (559) — (559)
Divestiture of businesses, net of cash divested . . — — 21 — 21
Intercompany dividend from subsidiary ....... 20 — — (20) —
Net increase in intercompany loans ......... — (121) — 121 —
Decrease (increase) in investment in subsidiaries 1,363 457 (1,950) 130 —
Decrease in investments ................. — — 59 — 59
Decrease in restricted cash ............... — — 7 — 7
Other .............................. — — (14) — (14)
Net cash provided by (used in) investing
activities ......................... 1,383 336 (3,725) 231 (1,775)
Net cash used in discontinued investing
activities ......................... — — (12) — (12)
Cash Flows From Financing Activities:
Net repayments of debt .................. — (158) (46) — (204)
Proceeds from exercise of share options ...... — — 49 — 49
Dividends paid ........................ (416) — — — (416)
Intercompany dividend to parent ........... — — (20) 20 —
Repurchase of common shares by treasury .... (575) — (325) — (900)
Net intercompany loan (repayments) borrowings (88) — 209 (121) —
Increase in equity from parent ............. — — 130 (130) —
Transfer from discontinued operations ....... — — 15 — 15
Other .............................. 21 (6) — — 15
Net cash (used in) provided by financing
activities ......................... (1,058) (164) 12 (231) (1,441)
Net cash used in discontinued financing
activities ......................... — — (15) — (15)
Effect of currency translation on cash ........ — — 7 — 7
Net decrease in cash and cash equivalents .... — — (579) — (579)
Cash and cash equivalents at beginning of
period ............................ — — 2,354 — 2,354
Cash and cash equivalents at end of period . . . $ — $ — $ 1,775 $ — $ 1,775
2011 Financials 169