ADT 2011 Annual Report Download - page 9
Download and view the complete annual report
Please find page 9 of the 2011 ADT annual report below. You can navigate through the pages in the report by either clicking on the pages listed below, or by using the keyword search tool below to find specific information within the annual report.-
 1
1 -
 2
2 -
 3
3 -
 4
4 -
 5
5 -
 6
6 -
 7
7 -
 8
8 -
 9
9 -
 10
10 -
 11
11 -
 12
12 -
 13
13 -
 14
14 -
 15
15 -
 16
16 -
 17
17 -
 18
18 -
 19
19 -
 20
20 -
21
-
22
-
23
-
24
-
25
-
26
-
27
-
28
-
29
-
30
-
31
-
32
-
33
-
34
-
35
-
36
-
37
-
38
-
39
-
40
-
41
-
42
-
43
-
44
-
45
-
46
-
47
-
48
-
49
-
50
-
51
-
52
-
53
-
54
-
55
-
56
-
57
-
58
-
59
-
60
-
61
-
62
-
63
-
64
-
65
-
66
-
67
-
68
-
69
-
70
-
71
-
72
-
73
-
74
-
75
-
76
-
77
-
78
-
79
-
80
-
81
-
82
-
83
-
84
-
85
-
86
-
87
-
88
-
89
-
90
-
91
-
92
-
93
-
94
-
95
-
96
-
97
-
98
-
99
-
100
-
101
-
102
-
103
-
104
-
105
-
106
-
107
-
108
-
109
-
110
-
111
-
112
-
113
-
114
-
115
-
116
-
117
-
118
-
119
-
120
-
121
-
122
-
123
-
124
-
125
-
126
-
127
-
128
-
129
-
130
-
131
-
132
-
133
-
134
-
135
-
136
-
137
-
138
-
139
-
140
-
141
-
142
-
143
-
144
-
145
-
146
-
147
-
148
-
149
-
150
-
151
-
152
-
153
-
154
-
155
-
156
-
157
-
158
-
159
-
160
-
161
-
162
-
163
-
164
-
165
-
166
-
167
-
168
-
169
-
170
-
171
-
172
-
173
-
174
-
175
-
176
-
177
-
178
-
179
-
180
-
181
-
182
-
183
-
184
-
185
-
186
-
187
-
188
-
189
-
190
-
191
-
192
-
193
-
194
-
195
-
196
-
197
-
198
-
199
-
200
-
201
-
202
-
203
-
204
-
205
-
206
-
207
-
208
-
209
-
210
-
211
-
212
-
213
-
214
-
215
-
216
-
217
-
218
-
219
-
220
-
221
-
222
-
223
-
224
-
225
-
226
-
227
-
228
-
229
-
230
-
231
-
232
-
233
-
234
-
235
-
236
-
237
-
238
-
239
-
240
-
241
-
242
-
243
-
244
-
245
-
246
-
247
-
248
-
249
-
250
-
251
-
252
-
253
-
254
-
255
-
256
-
257
-
258
-
259
-
260
-
261
-
262
-
263
-
264
-
265
-
266
-
267
-
268
-
269
-
270
-
271
-
272
-
273
-
274
-
275
-
276
-
277
-
278
-
279
-
280
-
281
-
282
-
283
-
284
-
285
-
286
-
287
-
288
-
289
-
290
-
291
-
292
-
293
-
294
-
295
-
296
-
297
-
298
-
299
-
300
-
301
-
302
-
303
-
304
-
305
-
306
-
307
-
308
-
309
-
310
-
311
-
312
-
313
 |
 |

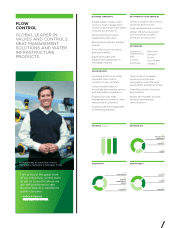
7
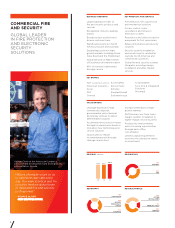
FLOW
CONTROL
GLOBAL LEADER IN
VALVES AND CONTROLS,
HEAT MANAGEMENT
SOLUTIONS AND WATER
INFRASTRUCTURE
PRODUCTS
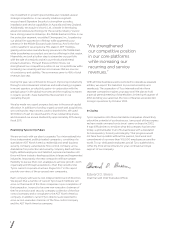
“ I am proud of the great work
of our entire flow control team
to get us to a point where we
are well positioned to take
the next step as a standalone
public company.”
— PATRICK DECKER
CHIEF EXECUTIVE OFFICER
Global leader in valves and
controls, heat management
solutions and large-scale water
infrastructure projects
Well positioned in large,
fragmented industries
Recognized industry-leading
brands
Diversified across products
and end markets
Significant scale with
established capabilities in
emerging markets
BUSINESS STRENGTHS
Valves, actuation and control
products and services
Heat management solutions
Water infrastructure and
environmental system
products and services
KEY PRODUCTS AND SERVICES
Anderson
Greenwood
Bi
Crosby
Keystone
Raychem
Sempell
Tracer
Tyco Water
Vanessa
KEY BRANDS
Leverage ability to provide
complete flow control
solutions in key verticals
Utilize installed base to
accelerate aftermarket service
and automation expansion
Expand turn-key heat
management systems to new
markets and customers
Expand scale and capabilities
in emerging markets
Opportunity to expand
product portfolio and
geographic reach through
acquisitions and partnerships
Simplify business structure
and systems
Broad end markets provide
revenue and earnings
diversification
VALUE DRIVERS
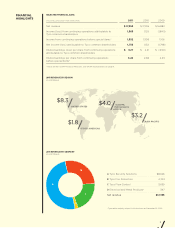
END MARKETS
37%
ENERGY
25%
WATE R
38%
PROCESS
GEOGRAPHY
41%
ASIA PACIFIC
30%
EUROPE,
MIDDLE EAST,
AFRICA
29%
AMERICAS
REVENUE MIX
60%
VALVES AND
CONTROLS
20%
THERMAL
20%
WATE R
REVENUE in billions
09 10 11
$3.5 $3.4 $3.6
Patrick Decker in a new flow control
manufacturing facility in Chengdu, China.