ADT 2011 Annual Report Download - page 149
Download and view the complete annual report
Please find page 149 of the 2011 ADT annual report below. You can navigate through the pages in the report by either clicking on the pages listed below, or by using the keyword search tool below to find specific information within the annual report.-
 1
1 -
2
-
3
-
4
-
5
-
6
-
7
-
8
-
9
-
10
-
11
-
12
-
13
-
14
-
15
-
16
-
17
-
18
-
19
-
20
-
21
-
22
-
23
-
24
-
25
-
26
-
27
-
28
-
29
-
30
-
31
-
32
-
33
-
34
-
35
-
36
-
37
-
38
-
39
-
40
-
41
-
42
-
43
-
44
-
45
-
46
-
47
-
48
-
49
-
50
-
51
-
52
-
53
-
54
-
55
-
56
-
57
-
58
-
59
-
60
-
61
-
62
-
63
-
64
-
65
-
66
-
67
-
68
-
69
-
70
-
71
-
72
-
73
-
74
-
75
-
76
-
77
-
78
-
79
-
80
-
81
-
82
-
83
-
84
-
85
-
86
-
87
-
88
-
89
-
90
-
91
-
92
-
93
-
94
-
95
-
96
-
97
-
98
-
99
-
100
-
101
-
102
-
103
-
104
-
105
-
106
-
107
-
108
-
109
-
110
-
111
-
112
-
113
-
114
-
115
-
116
-
117
-
118
-
119
-
120
-
121
-
122
-
123
-
124
-
125
-
126
-
127
-
128
-
129
-
130
-
131
-
132
-
133
-
134
-
135
-
136
-
137
-
138
-
 139
139 -
 140
140 -
 141
141 -
 142
142 -
 143
143 -
 144
144 -
 145
145 -
 146
146 -
 147
147 -
 148
148 -
 149
149 -
 150
150 -
 151
151 -
 152
152 -
 153
153 -
 154
154 -
 155
155 -
 156
156 -
 157
157 -
 158
158 -
 159
159 -
160
-
161
-
162
-
163
-
164
-
165
-
166
-
167
-
168
-
169
-
170
-
171
-
172
-
173
-
174
-
175
-
176
-
177
-
178
-
179
-
180
-
181
-
182
-
183
-
184
-
185
-
186
-
187
-
188
-
189
-
190
-
191
-
192
-
193
-
194
-
195
-
196
-
197
-
198
-
199
-
200
-
201
-
202
-
203
-
204
-
205
-
206
-
207
-
208
-
209
-
210
-
211
-
212
-
213
-
214
-
215
-
216
-
217
-
218
-
219
-
220
-
221
-
222
-
223
-
224
-
225
-
226
-
227
-
228
-
229
-
230
-
231
-
232
-
233
-
234
-
235
-
236
-
237
-
238
-
239
-
240
-
241
-
242
-
243
-
244
-
245
-
246
-
247
-
248
-
249
-
250
-
251
-
252
-
253
-
254
-
255
-
256
-
257
-
258
-
259
-
260
-
261
-
262
-
263
-
264
-
265
-
266
-
267
-
268
-
269
-
270
-
271
-
272
-
273
-
274
-
275
-
276
-
277
-
278
-
279
-
280
-
281
-
282
-
283
-
284
-
285
-
286
-
287
-
288
-
289
-
290
-
291
-
292
-
293
-
294
-
295
-
296
-
297
-
298
-
299
-
300
-
301
-
302
-
303
-
304
-
305
-
306
-
307
-
308
-
309
-
310
-
311
-
312
-
313
 |
 |

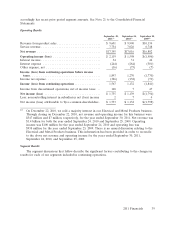
Revenue from product sales
Systems installation and related products
Revenue from product sales includes sales and installation of fire protection and other systems.
Revenue from systems installation decreased by $4 million, or 0.2%, during the year ended
September 30, 2011, as compared to the year ended September 24, 2010. Changes in foreign currency
exchange rates favorably impacted systems installation revenue by $45 million, or 2.8%, while the
deconsolidation of a joint venture discussed above unfavorably impacted systems installation by
$51 million, or 3.1%. Revenue from systems installation was also unfavorably impacted by project
selectivity resulting from a focus on higher margin projects across all regions.
Revenue from systems installation decreased by $123 million, or 7.1%, during the year ended
September 24, 2010, as compared to the year ended September 25, 2009. Changes in foreign currency
exchange rates favorably impacted systems installation revenue by $56 million, or 3.2%. Despite the
favorable impact of foreign currency, revenue decreased due to decreased upgrade activity from
customers, and project selectivity resulting from a focus on higher margin project across all regions.
Product sales
Revenue from product sales increased by $164 million, or 14.2%, during the year ended
September 30, 2011, as compared to the year ended September 24, 2010. Changes in foreign currency
exchange rates favorably impacted product revenue by $24 million, or 2.1%. The remaining increase in
net revenue was driven by increased volumes due to improved end-market demand and implementation
of pricing actions to offset commodity inflationary pressures.
Revenue from product sales decreased by $50 million, or 4.1%, during the year ended
September 24, 2010, as compared to the year ended September 25, 2009. Product revenue was
unfavorably impacted by the estimated impact of $32 million, or 2.7% of divestitures. This decrease was
partially offset by changes in foreign currency exchange rates which favorably impacted product revenue
by $13 million, or 1.1%. The remaining decrease was due to weakness in end-market demand.
Service revenue
Service revenue consists of inspection, maintenance, monitoring and repair of fire detection,
suppression and other life safety systems. Service revenue increased by $73 million, or 4.2%, during the
year ended September 30, 2011, as compared to the year ended September 24, 2010. Changes in
foreign currency exchange rates favorably impacted service revenue by $56 million, or 3.2%, while the
deconsolidation of a joint venture discussed above unfavorably impacted service revenue by $21 million,
or 1.2%. The remaining increase in service revenue was as a result of management’s continued focus
on expanding our recurring service revenue across all regions.
Service revenue increased by $63 million, or 3.8%, during the year ended September 24, 2010, as
compared to the year ended September 25, 2009. Changes in foreign currency exchange rates favorably
impacted service revenue by $61 million, or 3.7%. Despite the favorable impact of foreign currency,
service revenue was flat due primarily to weakness in the European markets.
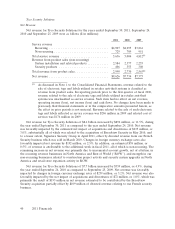
Operating Income and Operating Margin
Operating income and operating margin for Tyco Fire Protection were as follows ($ in millions):
2011 2010 2009
Operating income ................................. $534 $460 $20
Operating margin ................................. 11.3% 10.2% —(1)
(1) Certain operating margins and percentages have not been presented as management
believes such calculations are not meaningful.
46 2011 Financials