ADT 2011 Annual Report Download - page 62
Download and view the complete annual report
Please find page 62 of the 2011 ADT annual report below. You can navigate through the pages in the report by either clicking on the pages listed below, or by using the keyword search tool below to find specific information within the annual report.-
 1
1 -
2
-
3
-
4
-
5
-
6
-
7
-
8
-
9
-
10
-
11
-
12
-
13
-
14
-
15
-
16
-
17
-
18
-
19
-
20
-
21
-
22
-
23
-
24
-
25
-
26
-
27
-
28
-
29
-
30
-
31
-
32
-
33
-
34
-
35
-
36
-
37
-
38
-
39
-
40
-
41
-
42
-
43
-
44
-
45
-
46
-
47
-
48
-
49
-
50
-
51
-
 52
52 -
 53
53 -
 54
54 -
 55
55 -
 56
56 -
 57
57 -
 58
58 -
 59
59 -
 60
60 -
 61
61 -
 62
62 -
 63
63 -
 64
64 -
 65
65 -
 66
66 -
 67
67 -
 68
68 -
 69
69 -
 70
70 -
 71
71 -
 72
72 -
73
-
74
-
75
-
76
-
77
-
78
-
79
-
80
-
81
-
82
-
83
-
84
-
85
-
86
-
87
-
88
-
89
-
90
-
91
-
92
-
93
-
94
-
95
-
96
-
97
-
98
-
99
-
100
-
101
-
102
-
103
-
104
-
105
-
106
-
107
-
108
-
109
-
110
-
111
-
112
-
113
-
114
-
115
-
116
-
117
-
118
-
119
-
120
-
121
-
122
-
123
-
124
-
125
-
126
-
127
-
128
-
129
-
130
-
131
-
132
-
133
-
134
-
135
-
136
-
137
-
138
-
139
-
140
-
141
-
142
-
143
-
144
-
145
-
146
-
147
-
148
-
149
-
150
-
151
-
152
-
153
-
154
-
155
-
156
-
157
-
158
-
159
-
160
-
161
-
162
-
163
-
164
-
165
-
166
-
167
-
168
-
169
-
170
-
171
-
172
-
173
-
174
-
175
-
176
-
177
-
178
-
179
-
180
-
181
-
182
-
183
-
184
-
185
-
186
-
187
-
188
-
189
-
190
-
191
-
192
-
193
-
194
-
195
-
196
-
197
-
198
-
199
-
200
-
201
-
202
-
203
-
204
-
205
-
206
-
207
-
208
-
209
-
210
-
211
-
212
-
213
-
214
-
215
-
216
-
217
-
218
-
219
-
220
-
221
-
222
-
223
-
224
-
225
-
226
-
227
-
228
-
229
-
230
-
231
-
232
-
233
-
234
-
235
-
236
-
237
-
238
-
239
-
240
-
241
-
242
-
243
-
244
-
245
-
246
-
247
-
248
-
249
-
250
-
251
-
252
-
253
-
254
-
255
-
256
-
257
-
258
-
259
-
260
-
261
-
262
-
263
-
264
-
265
-
266
-
267
-
268
-
269
-
270
-
271
-
272
-
273
-
274
-
275
-
276
-
277
-
278
-
279
-
280
-
281
-
282
-
283
-
284
-
285
-
286
-
287
-
288
-
289
-
290
-
291
-
292
-
293
-
294
-
295
-
296
-
297
-
298
-
299
-
300
-
301
-
302
-
303
-
304
-
305
-
306
-
307
-
308
-
309
-
310
-
311
-
312
-
313
 |
 |

13DEC201119501435
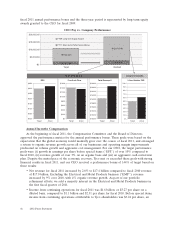
stock options. The table below demonstrates the link between Company performance and the realizable
value of the CEO’s long-term equity for post-2007 Separation performance periods:
Target vs. Realizable LTI over Completed Performance Periods
-7.13%
21.03%
-10.00%
-5.00%
0.00%
5.00%
10.00%
15.00%
20.00%
25.00%
$0.0M
$2.0M
$4.0M
$6.0M
$8.0M
$10.0M
$12.0M
$14.0M
$16.0M
FY08 - FY10 FY09 - FY11
3 Yr TSR
LTI Value
Tar
g
et Realized 3 Yr TSR
(1) Three year total shareholder return (TSR) is calculated for the periods beginning as of the first
day of fiscal years 2008 and 2009 and ending on the last day of the fiscal years 2010 and 2011.
(2) Target amounts represent the grant-date fair value of the stock options, PSUs and RSUs granted
for fiscal 2008 and stock options and PSUs granted for fiscal 2009.
(3) Realized amounts represent the realizable value of equity awards granted in respect of fiscal years
2008 and 2009 as of the end of the applicable three-year period. For stock options, these values
are the in-the-money value as of the last day of fiscal year 2010 and 2011, as applicable. For PSUs,
these values are the market value, as of the last day of the fiscal year, of shares delivered based on
actual performance results in respect of the applicable three-year plan. For RSUs, these values
represent the value of vested and unvested awards granted in 2008 as of the end of fiscal year
2010.
In fiscal 2011, the performance period for PSUs granted at the beginning of fiscal 2009 expired.
Over this period, the Company’s total shareholder return, as calculated under the performance share
plan, was 13.16%*, which was better than 60% of the companies in the S&P 500 Industrials Index and
resulted in a pay-out at the end of fiscal 2011 of 144% of the target shares granted to Mr. Breen in
fiscal 2009. The in-the-money value of stock options granted to Mr. Breen at the beginning of fiscal
2009 has grown in-line with the appreciation in share price. One-half of this option grant remained
unvested as of September 30, 2011.
The results under the performance share plan at the end of fiscal 2011 contrast sharply with those
for fiscal 2010. In fiscal 2010, the first performance period for PSUs granted immediately after the
2007 Separation expired. These PSUs were granted in July 2007 and represented the annual equity
award for fiscal 2008. Last year, the Company’s relative TSR for the three-year period ending in June
2010 was below the minimum performance threshold under the plan. As a result, performance share
units granted in July 2007 expired with no realized value. Additionally, stock options granted to
Mr. Breen in July 2007 were out of the money. Only restricted stock units that were granted in July
2007 have provided value to this point in time.
* TSR under the performance share plan differs from amounts shown above due to the averaging
mechanism in the plan, which calculates TSR based on the average share price over the 20-day
period preceding commencement and end of the performance period.
48 2012 Proxy Statement