ADT 2011 Annual Report Download - page 243
Download and view the complete annual report
Please find page 243 of the 2011 ADT annual report below. You can navigate through the pages in the report by either clicking on the pages listed below, or by using the keyword search tool below to find specific information within the annual report.-
 1
1 -
2
-
3
-
4
-
5
-
6
-
7
-
8
-
9
-
10
-
11
-
12
-
13
-
14
-
15
-
16
-
17
-
18
-
19
-
20
-
21
-
22
-
23
-
24
-
25
-
26
-
27
-
28
-
29
-
30
-
31
-
32
-
33
-
34
-
35
-
36
-
37
-
38
-
39
-
40
-
41
-
42
-
43
-
44
-
45
-
46
-
47
-
48
-
49
-
50
-
51
-
52
-
53
-
54
-
55
-
56
-
57
-
58
-
59
-
60
-
61
-
62
-
63
-
64
-
65
-
66
-
67
-
68
-
69
-
70
-
71
-
72
-
73
-
74
-
75
-
76
-
77
-
78
-
79
-
80
-
81
-
82
-
83
-
84
-
85
-
86
-
87
-
88
-
89
-
90
-
91
-
92
-
93
-
94
-
95
-
96
-
97
-
98
-
99
-
100
-
101
-
102
-
103
-
104
-
105
-
106
-
107
-
108
-
109
-
110
-
111
-
112
-
113
-
114
-
115
-
116
-
117
-
118
-
119
-
120
-
121
-
122
-
123
-
124
-
125
-
126
-
127
-
128
-
129
-
130
-
131
-
132
-
133
-
134
-
135
-
136
-
137
-
138
-
139
-
140
-
141
-
142
-
143
-
144
-
145
-
146
-
147
-
148
-
149
-
150
-
151
-
152
-
153
-
154
-
155
-
156
-
157
-
158
-
159
-
160
-
161
-
162
-
163
-
164
-
165
-
166
-
167
-
168
-
169
-
170
-
171
-
172
-
173
-
174
-
175
-
176
-
177
-
178
-
179
-
180
-
181
-
182
-
183
-
184
-
185
-
186
-
187
-
188
-
189
-
190
-
191
-
192
-
193
-
194
-
195
-
196
-
197
-
198
-
199
-
200
-
201
-
202
-
203
-
204
-
205
-
206
-
207
-
208
-
209
-
210
-
211
-
212
-
213
-
214
-
215
-
216
-
217
-
218
-
219
-
220
-
221
-
222
-
223
-
224
-
225
-
226
-
227
-
228
-
229
-
230
-
231
-
232
-
 233
233 -
 234
234 -
 235
235 -
 236
236 -
 237
237 -
 238
238 -
 239
239 -
 240
240 -
 241
241 -
 242
242 -
 243
243 -
 244
244 -
 245
245 -
 246
246 -
 247
247 -
 248
248 -
 249
249 -
 250
250 -
 251
251 -
 252
252 -
 253
253 -
254
-
255
-
256
-
257
-
258
-
259
-
260
-
261
-
262
-
263
-
264
-
265
-
266
-
267
-
268
-
269
-
270
-
271
-
272
-
273
-
274
-
275
-
276
-
277
-
278
-
279
-
280
-
281
-
282
-
283
-
284
-
285
-
286
-
287
-
288
-
289
-
290
-
291
-
292
-
293
-
294
-
295
-
296
-
297
-
298
-
299
-
300
-
301
-
302
-
303
-
304
-
305
-
306
-
307
-
308
-
309
-
310
-
311
-
312
-
313
 |
 |

TYCO INTERNATIONAL LTD.
NOTES TO CONSOLIDATED FINANCIAL STATEMENTS (Continued)
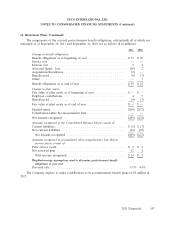
16. Retirement Plans (Continued)
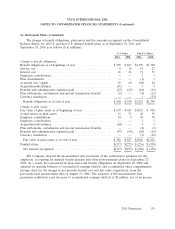
tax benefit of $2 million, and a net increase to accumulated other comprehensive loss of $61 million,
net of income taxes of $28 million.
U.S. Plans Non-U.S. Plans
2011 2010 2011 2010
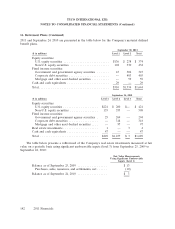
Amounts recognized in the Consolidated Balance Sheets consist of:
Non-current assets ...................................... $ — $ — $ 7 $ 2
Current liabilities ....................................... (3) (3) (13) (13)
Non-current liabilities .................................... (314) (270) (250) (347)
Net amount recognized ................................. $(317) $(273) $(256) $(358)
Amounts recognized in accumulated other comprehensive loss (before
income taxes) consist of:
Transition asset ......................................... $ — $ — $ 3 $ 3
Prior service cost ....................................... — (6) — (1)
Net actuarial loss ....................................... (430) (374) (362) (426)
Total loss recognized ................................... $(430) $(380) $(359) $(424)
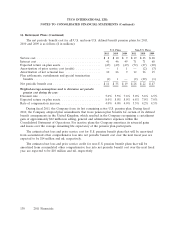
Weighted-average assumptions used to determine pension benefit obligations
at year end:
Discount rate .......................................... 4.5% 5.0% 5.1% 5.0%
Rate of compensation increase ............................. N/A 4.0% 3.3% 3.5%
The accumulated benefit obligation for all U.S. plans as of September 30, 2011 and September 24,
2010 was $898 million and $929 million, respectively. The accumulated benefit obligation for all
non-U.S. plans as of September 30, 2011 and September 24, 2010 was $1,300 million and
$1,366 million, respectively.
The accumulated benefit obligation and fair value of plan assets for U.S. pension plans with
accumulated benefit obligations in excess of plan assets were $898 million and $581 million,
respectively, as of September 30, 2011 and $929 million and $657 million, respectively, as of
September 24, 2010.
The accumulated benefit obligation and fair value of plan assets for non-U.S. pension plans with
accumulated benefit obligations in excess of plan assets were $1,275 million and $1,029 million,
respectively, as of September 30, 2011 and $1,344 million and $1,006 million, respectively, as of
September 24, 2010.
The aggregate benefit obligation and fair value of plan assets for U.S. pension plans with benefit
obligations in excess of plan assets were $898 million and $581 million, respectively, as of
September 30, 2011 and $930 million and $657 million, respectively, as of September 24, 2010.
The aggregate benefit obligation and fair value of plan assets for non-U.S. pension plans with
benefit obligations in excess of plan assets were $1,292 million and $1,029 million, respectively, as of
September 30, 2011 and $1,365 million and $1,006 million, respectively, as of September 24, 2010.
140 2011 Financials