ADT 2011 Annual Report Download - page 59
Download and view the complete annual report
Please find page 59 of the 2011 ADT annual report below. You can navigate through the pages in the report by either clicking on the pages listed below, or by using the keyword search tool below to find specific information within the annual report.-
 1
1 -
2
-
3
-
4
-
5
-
6
-
7
-
8
-
9
-
10
-
11
-
12
-
13
-
14
-
15
-
16
-
17
-
18
-
19
-
20
-
21
-
22
-
23
-
24
-
25
-
26
-
27
-
28
-
29
-
30
-
31
-
32
-
33
-
34
-
35
-
36
-
37
-
38
-
39
-
40
-
41
-
42
-
43
-
44
-
45
-
46
-
47
-
48
-
 49
49 -
 50
50 -
 51
51 -
 52
52 -
 53
53 -
 54
54 -
 55
55 -
 56
56 -
 57
57 -
 58
58 -
 59
59 -
 60
60 -
 61
61 -
 62
62 -
 63
63 -
 64
64 -
 65
65 -
 66
66 -
 67
67 -
 68
68 -
 69
69 -
70
-
71
-
72
-
73
-
74
-
75
-
76
-
77
-
78
-
79
-
80
-
81
-
82
-
83
-
84
-
85
-
86
-
87
-
88
-
89
-
90
-
91
-
92
-
93
-
94
-
95
-
96
-
97
-
98
-
99
-
100
-
101
-
102
-
103
-
104
-
105
-
106
-
107
-
108
-
109
-
110
-
111
-
112
-
113
-
114
-
115
-
116
-
117
-
118
-
119
-
120
-
121
-
122
-
123
-
124
-
125
-
126
-
127
-
128
-
129
-
130
-
131
-
132
-
133
-
134
-
135
-
136
-
137
-
138
-
139
-
140
-
141
-
142
-
143
-
144
-
145
-
146
-
147
-
148
-
149
-
150
-
151
-
152
-
153
-
154
-
155
-
156
-
157
-
158
-
159
-
160
-
161
-
162
-
163
-
164
-
165
-
166
-
167
-
168
-
169
-
170
-
171
-
172
-
173
-
174
-
175
-
176
-
177
-
178
-
179
-
180
-
181
-
182
-
183
-
184
-
185
-
186
-
187
-
188
-
189
-
190
-
191
-
192
-
193
-
194
-
195
-
196
-
197
-
198
-
199
-
200
-
201
-
202
-
203
-
204
-
205
-
206
-
207
-
208
-
209
-
210
-
211
-
212
-
213
-
214
-
215
-
216
-
217
-
218
-
219
-
220
-
221
-
222
-
223
-
224
-
225
-
226
-
227
-
228
-
229
-
230
-
231
-
232
-
233
-
234
-
235
-
236
-
237
-
238
-
239
-
240
-
241
-
242
-
243
-
244
-
245
-
246
-
247
-
248
-
249
-
250
-
251
-
252
-
253
-
254
-
255
-
256
-
257
-
258
-
259
-
260
-
261
-
262
-
263
-
264
-
265
-
266
-
267
-
268
-
269
-
270
-
271
-
272
-
273
-
274
-
275
-
276
-
277
-
278
-
279
-
280
-
281
-
282
-
283
-
284
-
285
-
286
-
287
-
288
-
289
-
290
-
291
-
292
-
293
-
294
-
295
-
296
-
297
-
298
-
299
-
300
-
301
-
302
-
303
-
304
-
305
-
306
-
307
-
308
-
309
-
310
-
311
-
312
-
313
 |
 |

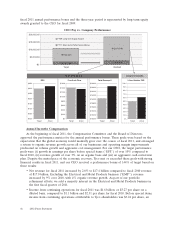
EXECUTIVE OFFICER COMPENSATION REPORT
Compensation Discussion and Analysis
The Compensation Discussion and Analysis section of this Proxy Statement discusses and analyzes
the executive compensation program for the named executive officers of Tyco in fiscal 2011: Edward D.
Breen, the Chairman and Chief Executive Officer; Frank S. Sklarsky, the Executive Vice President and
Chief Financial Officer; George R. Oliver, President, Tyco Fire Protection; Naren K. Gursahaney,
President, Tyco Security Solutions; and Judith A. Reinsdorf, Executive Vice President and General
Counsel. In addition, information regarding Mr. Christopher J. Coughlin, the Company’s Executive
Vice President and Chief Financial Officer through December 1, 2010, is provided. Unless otherwise
specified, the references to the ‘‘named executive officers’’ in this Compensation Discussion and
Analysis are to our current officers. Many of the metrics used to judge performance under our
executive compensation programs are non-GAAP financial measures and the discussion below includes
references to such measures, which should not be considered as replacements for GAAP measures.
Please see the tables included in Annex A to this proxy statement for a reconciliation of these
measures to the most comparable GAAP measures.
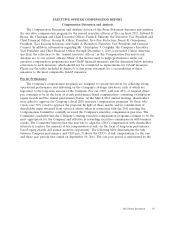
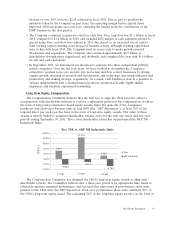
Pay for Performance
The Company’s compensation programs are designed to reward executives for achieving strong
operational performance and delivering on the Company’s strategic initiatives, each of which are
important to the long-term success of the Company. For our CEO, well over 85% of targeted direct
pay continues to be in the form of at-risk performance-based compensation—consisting of long-term
equity awards and the annual performance bonus. At the March 2011 annual meeting, shareholders
were asked to approve the Company’s fiscal 2010 executive compensation programs. Of those who
voted, over 72% voted to approve the proposal. In light of these results, and in consideration of
shareholder input obtained from outreach efforts taken in connection with the 2011 meeting, the
Compensation Committee carefully reviewed the Company’s executive compensation practices. The
Committee concluded that the Company’s existing executive compensation programs continue to be the
most appropriate for the Company and effective in rewarding executives commensurate with business
results. The Committee believes that the best way to align the CEO’s compensation with shareholder
interests is to place the majority of his compensation at-risk—in the form of long-term performance
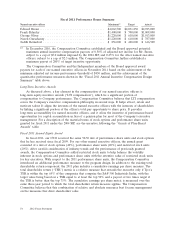
based equity awards and annual incentive opportunity. The following table demonstrates the link
between Company performance and CEO pay. It shows the CEO’s at-risk compensation for the one
and three year periods that ended on September 30, 2011. The one-year period is represented by the
2012 Proxy Statement 45