ADT 2011 Annual Report Download - page 299
Download and view the complete annual report
Please find page 299 of the 2011 ADT annual report below. You can navigate through the pages in the report by either clicking on the pages listed below, or by using the keyword search tool below to find specific information within the annual report.-
 1
1 -
2
-
3
-
4
-
5
-
6
-
7
-
8
-
9
-
10
-
11
-
12
-
13
-
14
-
15
-
16
-
17
-
18
-
19
-
20
-
21
-
22
-
23
-
24
-
25
-
26
-
27
-
28
-
29
-
30
-
31
-
32
-
33
-
34
-
35
-
36
-
37
-
38
-
39
-
40
-
41
-
42
-
43
-
44
-
45
-
46
-
47
-
48
-
49
-
50
-
51
-
52
-
53
-
54
-
55
-
56
-
57
-
58
-
59
-
60
-
61
-
62
-
63
-
64
-
65
-
66
-
67
-
68
-
69
-
70
-
71
-
72
-
73
-
74
-
75
-
76
-
77
-
78
-
79
-
80
-
81
-
82
-
83
-
84
-
85
-
86
-
87
-
88
-
89
-
90
-
91
-
92
-
93
-
94
-
95
-
96
-
97
-
98
-
99
-
100
-
101
-
102
-
103
-
104
-
105
-
106
-
107
-
108
-
109
-
110
-
111
-
112
-
113
-
114
-
115
-
116
-
117
-
118
-
119
-
120
-
121
-
122
-
123
-
124
-
125
-
126
-
127
-
128
-
129
-
130
-
131
-
132
-
133
-
134
-
135
-
136
-
137
-
138
-
139
-
140
-
141
-
142
-
143
-
144
-
145
-
146
-
147
-
148
-
149
-
150
-
151
-
152
-
153
-
154
-
155
-
156
-
157
-
158
-
159
-
160
-
161
-
162
-
163
-
164
-
165
-
166
-
167
-
168
-
169
-
170
-
171
-
172
-
173
-
174
-
175
-
176
-
177
-
178
-
179
-
180
-
181
-
182
-
183
-
184
-
185
-
186
-
187
-
188
-
189
-
190
-
191
-
192
-
193
-
194
-
195
-
196
-
197
-
198
-
199
-
200
-
201
-
202
-
203
-
204
-
205
-
206
-
207
-
208
-
209
-
210
-
211
-
212
-
213
-
214
-
215
-
216
-
217
-
218
-
219
-
220
-
221
-
222
-
223
-
224
-
225
-
226
-
227
-
228
-
229
-
230
-
231
-
232
-
233
-
234
-
235
-
236
-
237
-
238
-
239
-
240
-
241
-
242
-
243
-
244
-
245
-
246
-
247
-
248
-
249
-
250
-
251
-
252
-
253
-
254
-
255
-
256
-
257
-
258
-
259
-
260
-
261
-
262
-
263
-
264
-
265
-
266
-
267
-
268
-
269
-
270
-
271
-
272
-
273
-
274
-
275
-
276
-
277
-
278
-
279
-
280
-
281
-
282
-
283
-
284
-
285
-
286
-
287
-
288
-
 289
289 -
 290
290 -
 291
291 -
 292
292 -
 293
293 -
 294
294 -
 295
295 -
 296
296 -
 297
297 -
 298
298 -
 299
299 -
 300
300 -
 301
301 -
 302
302 -
 303
303 -
 304
304 -
 305
305 -
 306
306 -
 307
307 -
 308
308 -
 309
309 -
310
-
311
-
312
-
313
 |
 |

TYCO INTERNATIONAL LTD.
NOTES TO THE FINANCIAL STATEMENTS FOR THE FISCAL YEAR ENDED SEPTEMBER 30, 2011
(Continued)
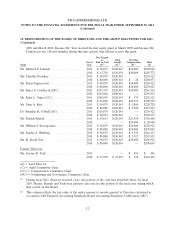
12. REMUNERATION OF THE BOARD OF DIRECTORS AND THE GROUP EXECUTIVES FOR 2011
(Continued)
2009 and March 2010. Because Mr. Yost received his first equity grant in March 2009 and because Mr.
Daniels was not a Board member during this time period, they did not receive this grant.
Fees Earned
or Stock All Other
Fiscal Paid in Cash Awards Compensation Total
Name Year ($)(1) ($)(2) ($)(3) ($)
Mr. Michael E. Daniels ................... 2011 $ 90,879 $120,043 $10,000 $220,922
2010 $ 43,736 $120,036 $40,000 $203,772
Mr. Timothy Donahue ................... 2011 $ 90,879 $120,043 — $210,922
2010 $ 80,000 $180,043 $ 28 $260,071
Mr. Brian Duperreault ................... 2011 $ 90,879 $120,043 $10,000 $220,922
2010 $ 80,000 $180,043 $10,000 $270,043
Mr. Bruce S. Gordon (L)(NC) .............. 2011 $131,319 $120,043 $10,000 $261,362
2010 $115,000 $180,043 — $295,043
Mr. Rajiv L. Gupta (CC) ................. 2011 $108,599 $120,043 $ 479 $229,121
2010 $ 95,000 $180,043 $25,356 $300,399
Mr. John A. Krol ....................... 2011 $ 90,879 $120,043 $ 9,806 $220,728
2010 $ 80,000 $180,043 $ 7,500 $267,543
Dr. Brendan R. O’Neill (AC) .............. 2011 $110,879 $120,043 — $230,922
2010 $ 90,934 $180,043 — $270,977
Mr. Dinesh Paliwal ...................... 2011 $ 54,615 $120,043 $21,950 $196,608
2010 — — $20,000 $ 20,000
Mr. William S. Stavropoulos ............... 2011 $ 90,879 $120,043 $10,000 $220,922
2010 $ 80,000 $180,043 $10,000 $270,043
Ms. Sandra S. Wijnberg ................... 2011 $ 90,879 $120,043 $ 5,195 $216,117
2010 $ 80,000 $180,043 $ 3,912 $263,955
Mr. R. David Yost ...................... 2011 $ 90,879 $120,043 $20,000 $230,922
2010 $ 80,000 $120,036 — $200,036
Former Directors:
Mr. Jerome B. York ..................... 2011 — — $ 456 $ 456
2010 $ 45,330 $ 67,013 $ 118 $112,461
(L) = Lead Director
(C) = Audit Committee Chair
(CC) = Compensation Committee Chair
(NC) = Nominating and Governance Committee Chair
(1) During fiscal 2011, directors received a pro rata portion of the cash fees described above. In fiscal
2010, Messrs. Daniels and York were paid pro rata fees for the portion of the fiscal year during which
they served on the Board.
(2) This column reflects the fair value of the entire amount of awards granted to Directors calculated in
accordance with Financial Accounting Standards Board Accounting Standards Codification (ASC)
12