ADT 2011 Annual Report Download - page 159
Download and view the complete annual report
Please find page 159 of the 2011 ADT annual report below. You can navigate through the pages in the report by either clicking on the pages listed below, or by using the keyword search tool below to find specific information within the annual report.-
 1
1 -
2
-
3
-
4
-
5
-
6
-
7
-
8
-
9
-
10
-
11
-
12
-
13
-
14
-
15
-
16
-
17
-
18
-
19
-
20
-
21
-
22
-
23
-
24
-
25
-
26
-
27
-
28
-
29
-
30
-
31
-
32
-
33
-
34
-
35
-
36
-
37
-
38
-
39
-
40
-
41
-
42
-
43
-
44
-
45
-
46
-
47
-
48
-
49
-
50
-
51
-
52
-
53
-
54
-
55
-
56
-
57
-
58
-
59
-
60
-
61
-
62
-
63
-
64
-
65
-
66
-
67
-
68
-
69
-
70
-
71
-
72
-
73
-
74
-
75
-
76
-
77
-
78
-
79
-
80
-
81
-
82
-
83
-
84
-
85
-
86
-
87
-
88
-
89
-
90
-
91
-
92
-
93
-
94
-
95
-
96
-
97
-
98
-
99
-
100
-
101
-
102
-
103
-
104
-
105
-
106
-
107
-
108
-
109
-
110
-
111
-
112
-
113
-
114
-
115
-
116
-
117
-
118
-
119
-
120
-
121
-
122
-
123
-
124
-
125
-
126
-
127
-
128
-
129
-
130
-
131
-
132
-
133
-
134
-
135
-
136
-
137
-
138
-
139
-
140
-
141
-
142
-
143
-
144
-
145
-
146
-
147
-
148
-
 149
149 -
 150
150 -
 151
151 -
 152
152 -
 153
153 -
 154
154 -
 155
155 -
 156
156 -
 157
157 -
 158
158 -
 159
159 -
 160
160 -
 161
161 -
 162
162 -
 163
163 -
 164
164 -
 165
165 -
 166
166 -
 167
167 -
 168
168 -
 169
169 -
170
-
171
-
172
-
173
-
174
-
175
-
176
-
177
-
178
-
179
-
180
-
181
-
182
-
183
-
184
-
185
-
186
-
187
-
188
-
189
-
190
-
191
-
192
-
193
-
194
-
195
-
196
-
197
-
198
-
199
-
200
-
201
-
202
-
203
-
204
-
205
-
206
-
207
-
208
-
209
-
210
-
211
-
212
-
213
-
214
-
215
-
216
-
217
-
218
-
219
-
220
-
221
-
222
-
223
-
224
-
225
-
226
-
227
-
228
-
229
-
230
-
231
-
232
-
233
-
234
-
235
-
236
-
237
-
238
-
239
-
240
-
241
-
242
-
243
-
244
-
245
-
246
-
247
-
248
-
249
-
250
-
251
-
252
-
253
-
254
-
255
-
256
-
257
-
258
-
259
-
260
-
261
-
262
-
263
-
264
-
265
-
266
-
267
-
268
-
269
-
270
-
271
-
272
-
273
-
274
-
275
-
276
-
277
-
278
-
279
-
280
-
281
-
282
-
283
-
284
-
285
-
286
-
287
-
288
-
289
-
290
-
291
-
292
-
293
-
294
-
295
-
296
-
297
-
298
-
299
-
300
-
301
-
302
-
303
-
304
-
305
-
306
-
307
-
308
-
309
-
310
-
311
-
312
-
313
 |
 |
Liquidity and Capital Resources
A fundamental objective of the Company is to have sufficient liquidity, balance sheet strength, and
financial flexibility to fund the operating and capital requirements of its core businesses around the
world. The primary source of funds to finance our operations and capital expenditures is cash
generated by operations. In addition, we maintain a commercial paper program, have access to
committed revolving credit facilities and have access to equity and debt capital from public and private
sources. We continue to balance our operating, investing and financing uses of cash through
investments and acquisitions in our core businesses, dividends and share repurchases. In addition, we
currently estimate that we will incur approximately $700 million in costs related to the 2012 Separation.
We believe our cash position, amounts available under our credit facilities and cash provided by
operating activities will be adequate to cover our operational and business needs in the foreseeable
future.
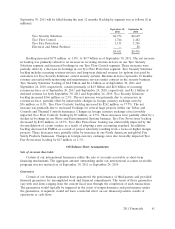
We had $1.4 billion and $1.8 billion of cash and cash equivalents as of September 30, 2011 and
September 24, 2010, respectively. Cash generated by operating activities decreased to $2.4 billion for
the year ended September 30, 2011 compared to $2.6 billion for the year ended September 24, 2010.
Cash used in investing activities was $1.3 billion for the year ended September 30, 2011 compared to
$1.8 billion for the year ended September 24, 2010. Cash used in financing activities was $1.5 billion for
the year ended September 30, 2011 compared to $1.4 billion for the year ended September 24, 2010.
As of September 30, 2011, our shareholder’s equity was $14.2 billion and our total debt was
$4.1 billion. In addition, we had lines of credit totaling approximately $1.5 billion, none of which were
drawn. Our ratio of total debt to total capital (the sum of our short- and long-term debt and
shareholders’ equity) was 23% as of both September 30, 2011 and September 24, 2010, respectively.
This ratio is a measure of our long-term liquidity and is an indicator of financial flexibility.
On January 12, 2011, TIFSA, our finance subsidiary, issued $250 million aggregate principal
amount of 3.75% notes due on January 15, 2018 and $250 million aggregate principal amount of
4.625% notes due on January 15, 2023, which are fully and unconditionally guaranteed by the
Company. TIFSA received net cash proceeds of approximately $494 million. The net proceeds, along
with other available funds, were used to fund the repayment of all of our outstanding 6.75% notes due
in February 2011 with a principal amount of $516 million.
On March 24, 2011, TIFSA, as the Borrower, and the Company as the Guarantor, entered into a
Four-Year Senior Unsecured Credit Agreement, providing for revolving credit commitments in the
aggregate amount of $750 million (the ‘‘Credit Agreement’’). In connection with entering into the
Credit Agreement, TIFSA and the Company terminated the existing Three-Year Senior Unsecured
Credit Agreement, dated June 24, 2008, which provided for revolving credit commitments in the
aggregate amount of $500 million, and which was scheduled to expire in June 2011. At the same time,
TIFSA also reduced the lenders’ commitments under its existing Five-Year Senior Unsecured Credit
Agreement, dated April 25, 2007, from an aggregate of $1.19 billion to $750 million, and which is
scheduled to expire in April 2012.
56 2011 Financials