ADT 2011 Annual Report Download - page 182
Download and view the complete annual report
Please find page 182 of the 2011 ADT annual report below. You can navigate through the pages in the report by either clicking on the pages listed below, or by using the keyword search tool below to find specific information within the annual report.-
 1
1 -
2
-
3
-
4
-
5
-
6
-
7
-
8
-
9
-
10
-
11
-
12
-
13
-
14
-
15
-
16
-
17
-
18
-
19
-
20
-
21
-
22
-
23
-
24
-
25
-
26
-
27
-
28
-
29
-
30
-
31
-
32
-
33
-
34
-
35
-
36
-
37
-
38
-
39
-
40
-
41
-
42
-
43
-
44
-
45
-
46
-
47
-
48
-
49
-
50
-
51
-
52
-
53
-
54
-
55
-
56
-
57
-
58
-
59
-
60
-
61
-
62
-
63
-
64
-
65
-
66
-
67
-
68
-
69
-
70
-
71
-
72
-
73
-
74
-
75
-
76
-
77
-
78
-
79
-
80
-
81
-
82
-
83
-
84
-
85
-
86
-
87
-
88
-
89
-
90
-
91
-
92
-
93
-
94
-
95
-
96
-
97
-
98
-
99
-
100
-
101
-
102
-
103
-
104
-
105
-
106
-
107
-
108
-
109
-
110
-
111
-
112
-
113
-
114
-
115
-
116
-
117
-
118
-
119
-
120
-
121
-
122
-
123
-
124
-
125
-
126
-
127
-
128
-
129
-
130
-
131
-
132
-
133
-
134
-
135
-
136
-
137
-
138
-
139
-
140
-
141
-
142
-
143
-
144
-
145
-
146
-
147
-
148
-
149
-
150
-
151
-
152
-
153
-
154
-
155
-
156
-
157
-
158
-
159
-
160
-
161
-
162
-
163
-
164
-
165
-
166
-
167
-
168
-
169
-
170
-
171
-
 172
172 -
 173
173 -
 174
174 -
 175
175 -
 176
176 -
 177
177 -
 178
178 -
 179
179 -
 180
180 -
 181
181 -
 182
182 -
 183
183 -
 184
184 -
 185
185 -
 186
186 -
 187
187 -
 188
188 -
 189
189 -
 190
190 -
 191
191 -
 192
192 -
193
-
194
-
195
-
196
-
197
-
198
-
199
-
200
-
201
-
202
-
203
-
204
-
205
-
206
-
207
-
208
-
209
-
210
-
211
-
212
-
213
-
214
-
215
-
216
-
217
-
218
-
219
-
220
-
221
-
222
-
223
-
224
-
225
-
226
-
227
-
228
-
229
-
230
-
231
-
232
-
233
-
234
-
235
-
236
-
237
-
238
-
239
-
240
-
241
-
242
-
243
-
244
-
245
-
246
-
247
-
248
-
249
-
250
-
251
-
252
-
253
-
254
-
255
-
256
-
257
-
258
-
259
-
260
-
261
-
262
-
263
-
264
-
265
-
266
-
267
-
268
-
269
-
270
-
271
-
272
-
273
-
274
-
275
-
276
-
277
-
278
-
279
-
280
-
281
-
282
-
283
-
284
-
285
-
286
-
287
-
288
-
289
-
290
-
291
-
292
-
293
-
294
-
295
-
296
-
297
-
298
-
299
-
300
-
301
-
302
-
303
-
304
-
305
-
306
-
307
-
308
-
309
-
310
-
311
-
312
-
313
 |
 |

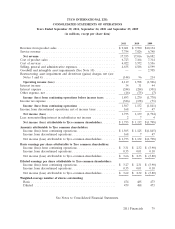
TYCO INTERNATIONAL LTD.
CONSOLIDATED STATEMENTS OF OPERATIONS
Years Ended September 30, 2011, September 24, 2010 and September 25, 2009
(in millions, except per share data)
2011 2010 2009
Revenue from product sales ................................. $ 9,601 $ 9,990 $10,134
Service revenue .......................................... 7,754 7,026 6,748
Net revenue ........................................... 17,355 17,016 16,882
Cost of product sales ...................................... 6,723 7,164 7,314
Cost of services .......................................... 4,022 3,572 3,556
Selling, general and administrative expenses ...................... 4,635 4,586 4,599
Goodwill and intangible asset impairments (See Note 10) ............ — — 2,705
Restructuring, asset impairment and divestiture (gains) charges, net (see
Notes 3 and 4) ......................................... (144) 96 214
Operating income (loss) .................................. 2,119 1,598 (1,506)
Interest income .......................................... 34 31 44
Interest expense .......................................... (244) (284) (301)
Other expense, net ........................................ (16) (75) (7)
Income (loss) from continuing operations before income taxes ...... 1,893 1,270 (1,770)
Income tax expense ....................................... (326) (138) (71)
Income (loss) from continuing operations ..................... 1,567 1,132 (1,841)
Income from discontinued operations, net of income taxes ........... 168 7 47
Net income (loss) ....................................... 1,735 1,139 (1,794)
Less: noncontrolling interest in subsidiaries net income .............274
Net income (loss) attributable to Tyco common shareholders ........ $ 1,733 $ 1,132 $(1,798)
Amounts attributable to Tyco common shareholders:
Income (loss) from continuing operations ...................... $ 1,565 $ 1,125 $(1,845)
Income from discontinued operations ......................... 168 7 47
Net income (loss) attributable to Tyco common shareholders ........ $ 1,733 $ 1,132 $ (1,798)
Basic earnings per share attributable to Tyco common shareholders:
Income (loss) from continuing operations ...................... $ 3.31 $ 2.32 $ (3.90)
Income from discontinued operations ......................... 0.35 0.01 0.10
Net income (loss) attributable to Tyco common shareholders ........ $ 3.66 $ 2.33 $ (3.80)
Diluted earnings per share attributable to Tyco common shareholders:
Income (loss) from continuing operations ...................... $ 3.27 $ 2.31 $ (3.90)
Income from discontinued operations ......................... 0.35 0.01 0.10
Net income (loss) attributable to Tyco common shareholders ........ $ 3.62 $ 2.32 $ (3.80)
Weighted-average number of shares outstanding:
Basic ................................................ 474 485 473
Diluted .............................................. 479 488 473
See Notes to Consolidated Financial Statements.
2011 Financials 79