ADT 2011 Annual Report Download - page 246
Download and view the complete annual report
Please find page 246 of the 2011 ADT annual report below. You can navigate through the pages in the report by either clicking on the pages listed below, or by using the keyword search tool below to find specific information within the annual report.-
 1
1 -
2
-
3
-
4
-
5
-
6
-
7
-
8
-
9
-
10
-
11
-
12
-
13
-
14
-
15
-
16
-
17
-
18
-
19
-
20
-
21
-
22
-
23
-
24
-
25
-
26
-
27
-
28
-
29
-
30
-
31
-
32
-
33
-
34
-
35
-
36
-
37
-
38
-
39
-
40
-
41
-
42
-
43
-
44
-
45
-
46
-
47
-
48
-
49
-
50
-
51
-
52
-
53
-
54
-
55
-
56
-
57
-
58
-
59
-
60
-
61
-
62
-
63
-
64
-
65
-
66
-
67
-
68
-
69
-
70
-
71
-
72
-
73
-
74
-
75
-
76
-
77
-
78
-
79
-
80
-
81
-
82
-
83
-
84
-
85
-
86
-
87
-
88
-
89
-
90
-
91
-
92
-
93
-
94
-
95
-
96
-
97
-
98
-
99
-
100
-
101
-
102
-
103
-
104
-
105
-
106
-
107
-
108
-
109
-
110
-
111
-
112
-
113
-
114
-
115
-
116
-
117
-
118
-
119
-
120
-
121
-
122
-
123
-
124
-
125
-
126
-
127
-
128
-
129
-
130
-
131
-
132
-
133
-
134
-
135
-
136
-
137
-
138
-
139
-
140
-
141
-
142
-
143
-
144
-
145
-
146
-
147
-
148
-
149
-
150
-
151
-
152
-
153
-
154
-
155
-
156
-
157
-
158
-
159
-
160
-
161
-
162
-
163
-
164
-
165
-
166
-
167
-
168
-
169
-
170
-
171
-
172
-
173
-
174
-
175
-
176
-
177
-
178
-
179
-
180
-
181
-
182
-
183
-
184
-
185
-
186
-
187
-
188
-
189
-
190
-
191
-
192
-
193
-
194
-
195
-
196
-
197
-
198
-
199
-
200
-
201
-
202
-
203
-
204
-
205
-
206
-
207
-
208
-
209
-
210
-
211
-
212
-
213
-
214
-
215
-
216
-
217
-
218
-
219
-
220
-
221
-
222
-
223
-
224
-
225
-
226
-
227
-
228
-
229
-
230
-
231
-
232
-
233
-
234
-
235
-
 236
236 -
 237
237 -
 238
238 -
 239
239 -
 240
240 -
 241
241 -
 242
242 -
 243
243 -
 244
244 -
 245
245 -
 246
246 -
 247
247 -
 248
248 -
 249
249 -
 250
250 -
 251
251 -
 252
252 -
 253
253 -
 254
254 -
 255
255 -
 256
256 -
257
-
258
-
259
-
260
-
261
-
262
-
263
-
264
-
265
-
266
-
267
-
268
-
269
-
270
-
271
-
272
-
273
-
274
-
275
-
276
-
277
-
278
-
279
-
280
-
281
-
282
-
283
-
284
-
285
-
286
-
287
-
288
-
289
-
290
-
291
-
292
-
293
-
294
-
295
-
296
-
297
-
298
-
299
-
300
-
301
-
302
-
303
-
304
-
305
-
306
-
307
-
308
-
309
-
310
-
311
-
312
-
313
 |
 |

TYCO INTERNATIONAL LTD.
NOTES TO CONSOLIDATED FINANCIAL STATEMENTS (Continued)
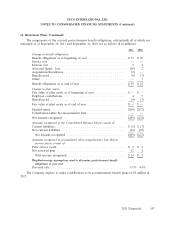
16. Retirement Plans (Continued)
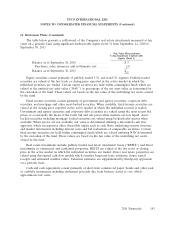
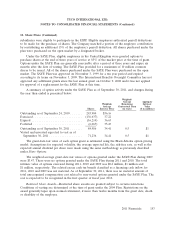
The table below presents a rollforward of the Company’s real estate investments measured at fair
value on a periodic basis using significant unobservable inputs (level 3) from September 24, 2010 to
September 30, 2011:
Fair Value Measurements
Using Significant Unobservable
Inputs (Level 3)
Balance as of September 24, 2010 ................. $3
Purchases, sales, issuances, and settlements, net ...... (3)
Balance as of September 30, 2011 ................. $—
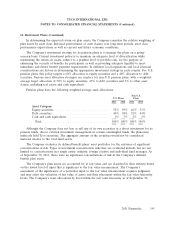
Equity securities consist primarily of publicly traded U.S. and non-U.S. equities. Publicly traded
securities are valued at the last trade or closing price reported in the active market in which the
individual securities are traded. Certain equity securities are held within commingled funds which are
valued at the unitized net asset value (‘‘NAV’’) or percentage of the net asset value as determined by
the custodian of the fund. These values are based on the fair value of the underlying net assets owned
by the fund.
Fixed income securities consist primarily of government and agency securities, corporate debt
securities, and mortgage and other asset-backed securities. When available, fixed income securities are
valued at the closing price reported in the active market in which the individual security is traded.
Government and agency securities and corporate debt securities are valued using the most recent bid
prices or occasionally the mean of the latest bid and ask prices when markets are less liquid. Asset-
backed securities including mortgage backed securities are valued using broker/dealer quotes when
available. When quotes are not available, fair value is determined utilizing a discounted cash flow
approach, which incorporates other observable inputs such as cash flows, underlying security structure
and market information including interest rates and bid evaluations of comparable securities. Certain
fixed income securities are held within commingled funds which are valued unitizing NAV determined
by the custodian of the fund. These values are based on the fair value of the underlying net assets
owned by the fund.
Real estate investments include publicly traded real estate investment trusts (‘‘REITS’’) and direct
investments in commercial and residential properties. REITS are valued at the last trade or closing
price in the active market in which the individual securities are traded. Direct real estate properties are
valued using discounted cash flow models which consider long-term lease estimates, future rental
receipts and estimated residual values. Valuation estimates are supplemented by third-party appraisals
on a periodic basis.
Cash and cash equivalents consist primarily of short-term commercial paper, bonds and other cash
or cash-like instruments including settlement proceeds due from brokers, stated at cost, which
approximates fair value.
2011 Financials 143