ADT 2011 Annual Report Download - page 85
Download and view the complete annual report
Please find page 85 of the 2011 ADT annual report below. You can navigate through the pages in the report by either clicking on the pages listed below, or by using the keyword search tool below to find specific information within the annual report.-
 1
1 -
2
-
3
-
4
-
5
-
6
-
7
-
8
-
9
-
10
-
11
-
12
-
13
-
14
-
15
-
16
-
17
-
18
-
19
-
20
-
21
-
22
-
23
-
24
-
25
-
26
-
27
-
28
-
29
-
30
-
31
-
32
-
33
-
34
-
35
-
36
-
37
-
38
-
39
-
40
-
41
-
42
-
43
-
44
-
45
-
46
-
47
-
48
-
49
-
50
-
51
-
52
-
53
-
54
-
55
-
56
-
57
-
58
-
59
-
60
-
61
-
62
-
63
-
64
-
65
-
66
-
67
-
68
-
69
-
70
-
71
-
72
-
73
-
74
-
 75
75 -
 76
76 -
 77
77 -
 78
78 -
 79
79 -
 80
80 -
 81
81 -
 82
82 -
 83
83 -
 84
84 -
 85
85 -
 86
86 -
 87
87 -
 88
88 -
 89
89 -
 90
90 -
 91
91 -
 92
92 -
 93
93 -
 94
94 -
 95
95 -
96
-
97
-
98
-
99
-
100
-
101
-
102
-
103
-
104
-
105
-
106
-
107
-
108
-
109
-
110
-
111
-
112
-
113
-
114
-
115
-
116
-
117
-
118
-
119
-
120
-
121
-
122
-
123
-
124
-
125
-
126
-
127
-
128
-
129
-
130
-
131
-
132
-
133
-
134
-
135
-
136
-
137
-
138
-
139
-
140
-
141
-
142
-
143
-
144
-
145
-
146
-
147
-
148
-
149
-
150
-
151
-
152
-
153
-
154
-
155
-
156
-
157
-
158
-
159
-
160
-
161
-
162
-
163
-
164
-
165
-
166
-
167
-
168
-
169
-
170
-
171
-
172
-
173
-
174
-
175
-
176
-
177
-
178
-
179
-
180
-
181
-
182
-
183
-
184
-
185
-
186
-
187
-
188
-
189
-
190
-
191
-
192
-
193
-
194
-
195
-
196
-
197
-
198
-
199
-
200
-
201
-
202
-
203
-
204
-
205
-
206
-
207
-
208
-
209
-
210
-
211
-
212
-
213
-
214
-
215
-
216
-
217
-
218
-
219
-
220
-
221
-
222
-
223
-
224
-
225
-
226
-
227
-
228
-
229
-
230
-
231
-
232
-
233
-
234
-
235
-
236
-
237
-
238
-
239
-
240
-
241
-
242
-
243
-
244
-
245
-
246
-
247
-
248
-
249
-
250
-
251
-
252
-
253
-
254
-
255
-
256
-
257
-
258
-
259
-
260
-
261
-
262
-
263
-
264
-
265
-
266
-
267
-
268
-
269
-
270
-
271
-
272
-
273
-
274
-
275
-
276
-
277
-
278
-
279
-
280
-
281
-
282
-
283
-
284
-
285
-
286
-
287
-
288
-
289
-
290
-
291
-
292
-
293
-
294
-
295
-
296
-
297
-
298
-
299
-
300
-
301
-
302
-
303
-
304
-
305
-
306
-
307
-
308
-
309
-
310
-
311
-
312
-
313
 |
 |
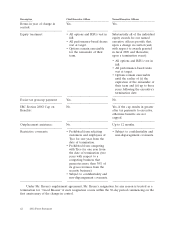
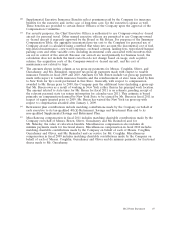
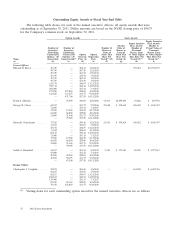
The Company made its annual grant of equity for fiscal 2011 in October 2010. The award for the
Chief Executive Officer consisted of stock options and performance share units. Other named executive
officers also received a mix of stock options, performance share units and restricted stock units.
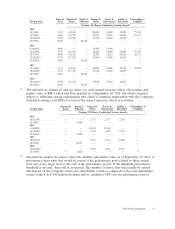
When the Company grants stock options, the exercise price equals the fair market value of our
common stock on the date of grant. Stock options generally vest in equal installments over a period of
four years, beginning on the first anniversary of the grant date. Each option holder has 10 years to
exercise his or her stock option from the date of grant, unless forfeited earlier.
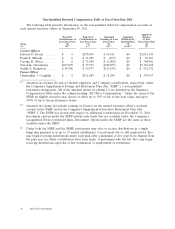
Performance share units generally vest at the end of the performance period. The number of
shares that are actually earned depends on whether, and at what level, the performance criteria have
been met. Performance share units granted in fiscal 2011 accrue dividends prior to vesting, which are
earned and paid out only to the extent that performance targets are achieved. Performance share units
do not have any voting rights. For performance share units granted in connection with the fiscal 2011
equity award, the relevant metrics are (i) Tyco’s three-year total shareholder return (‘‘TSR’’) between
September 25, 2010 and September 27, 2013 (50% weighting) and (ii) Tyco’s cumulative earnings per
share before special items (‘‘cumulative EPS’’) over the same period (50% weighting). Tyco’ TSR is to
be compared with the total shareholder return of all the companies in the S&P 500 Industrials Index
for the same period. The TSR return measure is based on the average of the closing stock price for the
60 trading days preceding, and the last 60 trading days of, the performance period, plus a total return
factor to reflect the reinvestment of dividends during the three-year period. If Tyco’s total shareholder
return is not equal to or better than the total shareholder return for 35% of the companies constituting
the S&P 500 Industrials Index, no shares will be delivered with respect to the TSR performance metric.
The cumulative EPS metric also contains a minimum performance threshold. The maximum number of
shares each named executive officer can receive with respect to the fiscal 2011 performance share plan
is two times the target number of shares granted. In addition, if the Company’s TSR is negative at the
end of the performance period, the maximum payout for the TSR metric is capped at 125% of the
target number of shares, with a similar cap for the cumulative EPS performance threshold.
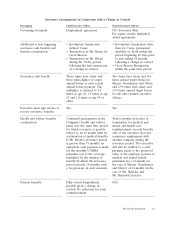
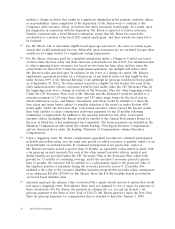
Forfeiture provisions related to involuntary terminations are described above under the heading
‘‘Change in Control and Severance Benefits.’’ Special termination provisions apply for employees who
are terminated in connection with the Separation. For a description of these provisions, please refer to
the Company’s Current Report on Form 8-K filed with the Securities and Exchange Commission on
October 14, 2011.
2012 Proxy Statement 71