ADT 2011 Annual Report Download - page 245
Download and view the complete annual report
Please find page 245 of the 2011 ADT annual report below. You can navigate through the pages in the report by either clicking on the pages listed below, or by using the keyword search tool below to find specific information within the annual report.-
 1
1 -
2
-
3
-
4
-
5
-
6
-
7
-
8
-
9
-
10
-
11
-
12
-
13
-
14
-
15
-
16
-
17
-
18
-
19
-
20
-
21
-
22
-
23
-
24
-
25
-
26
-
27
-
28
-
29
-
30
-
31
-
32
-
33
-
34
-
35
-
36
-
37
-
38
-
39
-
40
-
41
-
42
-
43
-
44
-
45
-
46
-
47
-
48
-
49
-
50
-
51
-
52
-
53
-
54
-
55
-
56
-
57
-
58
-
59
-
60
-
61
-
62
-
63
-
64
-
65
-
66
-
67
-
68
-
69
-
70
-
71
-
72
-
73
-
74
-
75
-
76
-
77
-
78
-
79
-
80
-
81
-
82
-
83
-
84
-
85
-
86
-
87
-
88
-
89
-
90
-
91
-
92
-
93
-
94
-
95
-
96
-
97
-
98
-
99
-
100
-
101
-
102
-
103
-
104
-
105
-
106
-
107
-
108
-
109
-
110
-
111
-
112
-
113
-
114
-
115
-
116
-
117
-
118
-
119
-
120
-
121
-
122
-
123
-
124
-
125
-
126
-
127
-
128
-
129
-
130
-
131
-
132
-
133
-
134
-
135
-
136
-
137
-
138
-
139
-
140
-
141
-
142
-
143
-
144
-
145
-
146
-
147
-
148
-
149
-
150
-
151
-
152
-
153
-
154
-
155
-
156
-
157
-
158
-
159
-
160
-
161
-
162
-
163
-
164
-
165
-
166
-
167
-
168
-
169
-
170
-
171
-
172
-
173
-
174
-
175
-
176
-
177
-
178
-
179
-
180
-
181
-
182
-
183
-
184
-
185
-
186
-
187
-
188
-
189
-
190
-
191
-
192
-
193
-
194
-
195
-
196
-
197
-
198
-
199
-
200
-
201
-
202
-
203
-
204
-
205
-
206
-
207
-
208
-
209
-
210
-
211
-
212
-
213
-
214
-
215
-
216
-
217
-
218
-
219
-
220
-
221
-
222
-
223
-
224
-
225
-
226
-
227
-
228
-
229
-
230
-
231
-
232
-
233
-
234
-
 235
235 -
 236
236 -
 237
237 -
 238
238 -
 239
239 -
 240
240 -
 241
241 -
 242
242 -
 243
243 -
 244
244 -
 245
245 -
 246
246 -
 247
247 -
 248
248 -
 249
249 -
 250
250 -
 251
251 -
 252
252 -
 253
253 -
 254
254 -
 255
255 -
256
-
257
-
258
-
259
-
260
-
261
-
262
-
263
-
264
-
265
-
266
-
267
-
268
-
269
-
270
-
271
-
272
-
273
-
274
-
275
-
276
-
277
-
278
-
279
-
280
-
281
-
282
-
283
-
284
-
285
-
286
-
287
-
288
-
289
-
290
-
291
-
292
-
293
-
294
-
295
-
296
-
297
-
298
-
299
-
300
-
301
-
302
-
303
-
304
-
305
-
306
-
307
-
308
-
309
-
310
-
311
-
312
-
313
 |
 |

TYCO INTERNATIONAL LTD.
NOTES TO CONSOLIDATED FINANCIAL STATEMENTS (Continued)
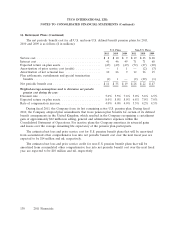
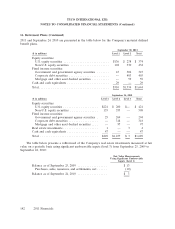
16. Retirement Plans (Continued)
2011 and September 24, 2010 are presented in the table below for the Company’s material defined
benefit plans.
September 30, 2011
($ in millions) Level 1 Level 2 Total
Equity securities:
U.S. equity securities .......................... $136 $ 238 $ 374
Non-U.S. equity securities ...................... 102 330 432
Fixed income securities:
Government and government agency securities ....... 43 304 347
Corporate debt securities ....................... — 403 403
Mortgage and other asset-backed securities .......... — 59 59
Cash and cash equivalents ........................ 29 — 29
Total ........................................ $310 $1,334 $1,644
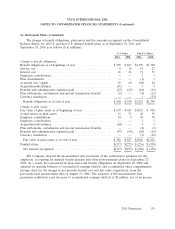
September 24, 2010
($ in millions) Level 1 Level 2 Level 3 Total
Equity securities:
U.S. equity securities .................... $221 $ 200 $— $ 421
Non-U.S. equity securities ................ 155 353 — 508
Fixed income securities:
Government and government agency securities . 25 269 — 294
Corporate debt securities ................. — 318 — 318
Mortgage and other asset-backed securities .... — 97 — 97
Real estate investments .................... 1 — 3 4
Cash and cash equivalents .................. 47 — — 47
Total ................................. $449 $1,237 $ 3 $1,689
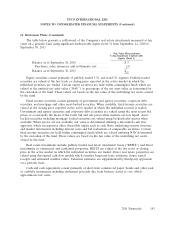
The table below presents a rollforward of the Company’s real estate investments measured at fair
value on a periodic basis using significant unobservable inputs (level 3) from September 25, 2009 to
September 24, 2010:
Fair Value Measurements
Using Significant Unobservable
Inputs (Level 3)
Balance as of September 25, 2009 ................. $13
Purchases, sales, issuances, and settlements, net ...... (10)
Balance as of September 24, 2010 ................. $ 3
142 2011 Financials