ADT 2011 Annual Report Download - page 66
Download and view the complete annual report
Please find page 66 of the 2011 ADT annual report below. You can navigate through the pages in the report by either clicking on the pages listed below, or by using the keyword search tool below to find specific information within the annual report.-
 1
1 -
2
-
3
-
4
-
5
-
6
-
7
-
8
-
9
-
10
-
11
-
12
-
13
-
14
-
15
-
16
-
17
-
18
-
19
-
20
-
21
-
22
-
23
-
24
-
25
-
26
-
27
-
28
-
29
-
30
-
31
-
32
-
33
-
34
-
35
-
36
-
37
-
38
-
39
-
40
-
41
-
42
-
43
-
44
-
45
-
46
-
47
-
48
-
49
-
50
-
51
-
52
-
53
-
54
-
55
-
 56
56 -
 57
57 -
 58
58 -
 59
59 -
 60
60 -
 61
61 -
 62
62 -
 63
63 -
 64
64 -
 65
65 -
 66
66 -
 67
67 -
 68
68 -
 69
69 -
 70
70 -
 71
71 -
 72
72 -
 73
73 -
 74
74 -
 75
75 -
 76
76 -
77
-
78
-
79
-
80
-
81
-
82
-
83
-
84
-
85
-
86
-
87
-
88
-
89
-
90
-
91
-
92
-
93
-
94
-
95
-
96
-
97
-
98
-
99
-
100
-
101
-
102
-
103
-
104
-
105
-
106
-
107
-
108
-
109
-
110
-
111
-
112
-
113
-
114
-
115
-
116
-
117
-
118
-
119
-
120
-
121
-
122
-
123
-
124
-
125
-
126
-
127
-
128
-
129
-
130
-
131
-
132
-
133
-
134
-
135
-
136
-
137
-
138
-
139
-
140
-
141
-
142
-
143
-
144
-
145
-
146
-
147
-
148
-
149
-
150
-
151
-
152
-
153
-
154
-
155
-
156
-
157
-
158
-
159
-
160
-
161
-
162
-
163
-
164
-
165
-
166
-
167
-
168
-
169
-
170
-
171
-
172
-
173
-
174
-
175
-
176
-
177
-
178
-
179
-
180
-
181
-
182
-
183
-
184
-
185
-
186
-
187
-
188
-
189
-
190
-
191
-
192
-
193
-
194
-
195
-
196
-
197
-
198
-
199
-
200
-
201
-
202
-
203
-
204
-
205
-
206
-
207
-
208
-
209
-
210
-
211
-
212
-
213
-
214
-
215
-
216
-
217
-
218
-
219
-
220
-
221
-
222
-
223
-
224
-
225
-
226
-
227
-
228
-
229
-
230
-
231
-
232
-
233
-
234
-
235
-
236
-
237
-
238
-
239
-
240
-
241
-
242
-
243
-
244
-
245
-
246
-
247
-
248
-
249
-
250
-
251
-
252
-
253
-
254
-
255
-
256
-
257
-
258
-
259
-
260
-
261
-
262
-
263
-
264
-
265
-
266
-
267
-
268
-
269
-
270
-
271
-
272
-
273
-
274
-
275
-
276
-
277
-
278
-
279
-
280
-
281
-
282
-
283
-
284
-
285
-
286
-
287
-
288
-
289
-
290
-
291
-
292
-
293
-
294
-
295
-
296
-
297
-
298
-
299
-
300
-
301
-
302
-
303
-
304
-
305
-
306
-
307
-
308
-
309
-
310
-
311
-
312
-
313
 |
 |
that changing any discrete pay element will have on the total compensation provided to each executive.
This data also clearly illustrates the effect that changing the core compensation elements will have on
our competitive positioning. Tally sheets also reveal how well each pay element is aligned with our
compensation philosophy and objectives, and show the value of all compensation elements under
multiple termination scenarios.
Base Salary
Base salary recognizes the value of an individual to Tyco based on his/her role, skill, performance,
contribution, leadership and potential. It is critical in attracting and retaining executive talent in the
markets in which we compete for talent. Base salaries are reviewed annually by both the Compensation
Committee and the Board. During fiscal 2011, the Committee approved 2% salary increases for
Ms. Reinsdorf and Mr. Oliver and a 9% increase for Mr. Gursahaney. These were the first salary
increases for the named executive officers since January 2008. Mr. Breen’s salary has remained
unchanged since 2006.
Annual Incentive Compensation
Annual incentive compensation for our named executive officers is paid in the form of an annual
performance bonus under the Company’s 2004 Stock and Incentive Plan (the ‘‘2004 SIP’’). Annual
incentive compensation rewards the named executive officers for their execution of the operating plan
and other strategic initiatives, as well as for financial performance that benefits the Company’s business
and drives long-term shareholder value creation. It places a meaningful proportion of total cash
compensation at risk, thereby aligning executive rewards with the Company’s financial results. It also
offers an opportunity for meaningful pay differentiation tied to the performance of individuals and
groups.
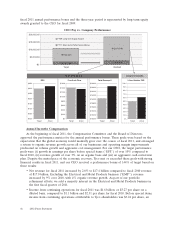
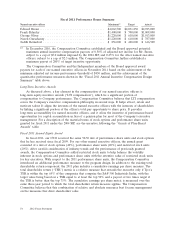
In the first quarter of fiscal 2011, the Compensation Committee established performance measures
and targets for the Company (and for each group, division and business segment), and they set a
minimum performance threshold of $450 million in adjusted net income (adjusted for (i) business
acquisitions and disposals, (ii) debt refinancing, (iii) legacy legal and tax matters, (iv) goodwill and
intangible asset impairments, (v) tax law changes, (vi) discontinued operations and (vii) changes in
accounting) that had to be met for named executive officers to receive any bonuses for the year. The
impact of these adjustments was not significant to the determination of whether the minimum threshold
was met. These metrics were also approved by the independent members of the Board. The
Compensation Committee also approved individual maximum bonus amounts for each Senior Officer of
0.5% of adjusted net income for Mr. Breen, subject to a cap of $5.0 million and 0.25% of adjusted net
income for Messrs. Sklarsky, Gursahaney and Oliver, and Ms. Reinsdorf, subject to a cap of
$2.5 million. After setting these minimum performance thresholds and maximum payouts, the
Compensation Committee further refined target and maximum payout values as a percentage of base
salary. Target incentive opportunities ranged from 80% to 125% of base salary for fiscal 2011 for the
named executive officers. Potential payouts ranged from 0% to 200% of the target incentive
opportunity.
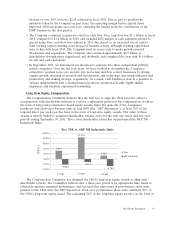
The performance measures approved for the corporate and group levels of the organization were
also established in the first quarter of fiscal 2011 and were used by the Compensation Committee and
the Board to determine final bonuses for named executive officers. As noted above, these performance
measures were based on the expectation that the global economy would modestly grow over the course
of fiscal 2011, with all of our businesses returning to organic revenue growth and operating margins
improving based on volume growth and aggressive cost management. For fiscal 2011, the Compensation
Committee increased the weighting of the revenue component for each executive in order to emphasize
the importance of organic growth at each unit. These performance measures and related results are
described in the table below.
52 2012 Proxy Statement