ADT 2011 Annual Report Download - page 277
Download and view the complete annual report
Please find page 277 of the 2011 ADT annual report below. You can navigate through the pages in the report by either clicking on the pages listed below, or by using the keyword search tool below to find specific information within the annual report.-
 1
1 -
2
-
3
-
4
-
5
-
6
-
7
-
8
-
9
-
10
-
11
-
12
-
13
-
14
-
15
-
16
-
17
-
18
-
19
-
20
-
21
-
22
-
23
-
24
-
25
-
26
-
27
-
28
-
29
-
30
-
31
-
32
-
33
-
34
-
35
-
36
-
37
-
38
-
39
-
40
-
41
-
42
-
43
-
44
-
45
-
46
-
47
-
48
-
49
-
50
-
51
-
52
-
53
-
54
-
55
-
56
-
57
-
58
-
59
-
60
-
61
-
62
-
63
-
64
-
65
-
66
-
67
-
68
-
69
-
70
-
71
-
72
-
73
-
74
-
75
-
76
-
77
-
78
-
79
-
80
-
81
-
82
-
83
-
84
-
85
-
86
-
87
-
88
-
89
-
90
-
91
-
92
-
93
-
94
-
95
-
96
-
97
-
98
-
99
-
100
-
101
-
102
-
103
-
104
-
105
-
106
-
107
-
108
-
109
-
110
-
111
-
112
-
113
-
114
-
115
-
116
-
117
-
118
-
119
-
120
-
121
-
122
-
123
-
124
-
125
-
126
-
127
-
128
-
129
-
130
-
131
-
132
-
133
-
134
-
135
-
136
-
137
-
138
-
139
-
140
-
141
-
142
-
143
-
144
-
145
-
146
-
147
-
148
-
149
-
150
-
151
-
152
-
153
-
154
-
155
-
156
-
157
-
158
-
159
-
160
-
161
-
162
-
163
-
164
-
165
-
166
-
167
-
168
-
169
-
170
-
171
-
172
-
173
-
174
-
175
-
176
-
177
-
178
-
179
-
180
-
181
-
182
-
183
-
184
-
185
-
186
-
187
-
188
-
189
-
190
-
191
-
192
-
193
-
194
-
195
-
196
-
197
-
198
-
199
-
200
-
201
-
202
-
203
-
204
-
205
-
206
-
207
-
208
-
209
-
210
-
211
-
212
-
213
-
214
-
215
-
216
-
217
-
218
-
219
-
220
-
221
-
222
-
223
-
224
-
225
-
226
-
227
-
228
-
229
-
230
-
231
-
232
-
233
-
234
-
235
-
236
-
237
-
238
-
239
-
240
-
241
-
242
-
243
-
244
-
245
-
246
-
247
-
248
-
249
-
250
-
251
-
252
-
253
-
254
-
255
-
256
-
257
-
258
-
259
-
260
-
261
-
262
-
263
-
264
-
265
-
266
-
 267
267 -
 268
268 -
 269
269 -
 270
270 -
 271
271 -
 272
272 -
 273
273 -
 274
274 -
 275
275 -
 276
276 -
 277
277 -
 278
278 -
 279
279 -
 280
280 -
 281
281 -
 282
282 -
 283
283 -
 284
284 -
 285
285 -
 286
286 -
 287
287 -
288
-
289
-
290
-
291
-
292
-
293
-
294
-
295
-
296
-
297
-
298
-
299
-
300
-
301
-
302
-
303
-
304
-
305
-
306
-
307
-
308
-
309
-
310
-
311
-
312
-
313
 |
 |

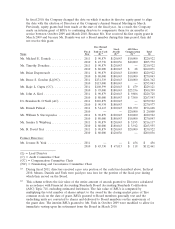
In fiscal 2010, the Company changed the date on which it makes its director equity grant to align
the date with the election of Directors at the Company’s Annual General Meeting in March.
Previously, equity grants had been made at the start of the fiscal year. As a result, the Company
made an interim grant of RSUs to continuing directors to compensate them for six months of
service between October 2009 and March 2010. Because Mr. Yost received his first equity grant in
March 2009 and because Mr. Daniels was not a Board member during this time period, they did
not receive this grant.
Fees Earned
or Stock All Other
Fiscal Paid in Cash Awards Compensation Total
Name Year ($)(1) ($)(2) ($)(3) ($)
Mr. Michael E. Daniels ................. 2011 $ 90,879 $120,043 $10,000 $220,922
2010 $ 43,736 $120,036 $40,000 $203,772
Mr. Timothy Donahue .................. 2011 $ 90,879 $120,043 — $210,922
2010 $ 80,000 $180,043 $ 28 $260,071
Mr. Brian Duperreault ................. 2011 $ 90,879 $120,043 $10,000 $220,922
2010 $ 80,000 $180,043 $10,000 $270,043
Mr. Bruce S. Gordon (L)(NC) ............ 2011 $131,319 $120,043 $10,000 $261,362
2010 $115,000 $180,043 — $295,043
Mr. Rajiv L. Gupta (CC) ................ 2011 $108,599 $120,043 $ 479 $229,121
2010 $ 95,000 $180,043 $25,356 $300,399
Mr. John A. Krol ..................... 2011 $ 90,879 $120,043 $ 9,806 $220,728
2010 $ 80,000 $180,043 $ 7,500 $267,543
Dr. Brendan R. O’Neill (AC) ............ 2011 $110,879 $120,043 — $230,922
2010 $ 90,934 $180,043 — $270,977
Mr. Dinesh Paliwal .................... 2011 $ 54,615 $120,043 $21,950 $196,608
2010 — — $20,000 $ 20,000
Mr. William S. Stavropoulos ............. 2011 $ 90,879 $120,043 $10,000 $220,922
2010 $ 80,000 $180,043 $10,000 $270,043
Ms. Sandra S. Wijnberg ................. 2011 $ 90,879 $120,043 $ 5,195 $216,117
2010 $ 80,000 $180,043 $ 3,912 $263,955
Mr. R. David Yost .................... 2011 $ 90,879 $120,043 $20,000 $230,922
2010 $ 80,000 $120,036 — $200,036
Former Directors:
Mr. Jerome B. York ................... 2011 — — $ 456 $ 456
2010 $ 45,330 $ 67,013 $ 118 $112,461
(L) = Lead Director
(C) = Audit Committee Chair
(CC) = Compensation Committee Chair
(NC) = Nominating and Governance Committee Chair
(1) During fiscal 2011, directors received a pro rata portion of the cash fees described above. In fiscal
2010, Messrs. Daniels and York were paid pro rata fees for the portion of the fiscal year during
which they served on the Board.
(2) This column reflects the fair value of the entire amount of awards granted to Directors calculated
in accordance with Financial Accounting Standards Board Accounting Standards Codification
(ASC) Topic 718, excluding estimated forfeitures. The fair value of RSUs is computed by
multiplying the total number of shares subject to the award by the closing market price of Tyco
common stock on the date of grant. RSUs granted to Board members generally vest and the
underlying units are converted to shares and delivered to Board members on the anniversary of
the grant date. The interim RSUs granted to Mr. York in October 2009 were modified to allow for
immediate vesting upon his retirement from the Board in March 2010.