ADT 2011 Annual Report Download - page 82
Download and view the complete annual report
Please find page 82 of the 2011 ADT annual report below. You can navigate through the pages in the report by either clicking on the pages listed below, or by using the keyword search tool below to find specific information within the annual report.-
 1
1 -
2
-
3
-
4
-
5
-
6
-
7
-
8
-
9
-
10
-
11
-
12
-
13
-
14
-
15
-
16
-
17
-
18
-
19
-
20
-
21
-
22
-
23
-
24
-
25
-
26
-
27
-
28
-
29
-
30
-
31
-
32
-
33
-
34
-
35
-
36
-
37
-
38
-
39
-
40
-
41
-
42
-
43
-
44
-
45
-
46
-
47
-
48
-
49
-
50
-
51
-
52
-
53
-
54
-
55
-
56
-
57
-
58
-
59
-
60
-
61
-
62
-
63
-
64
-
65
-
66
-
67
-
68
-
69
-
70
-
71
-
 72
72 -
 73
73 -
 74
74 -
 75
75 -
 76
76 -
 77
77 -
 78
78 -
 79
79 -
 80
80 -
 81
81 -
 82
82 -
 83
83 -
 84
84 -
 85
85 -
 86
86 -
 87
87 -
 88
88 -
 89
89 -
 90
90 -
 91
91 -
 92
92 -
93
-
94
-
95
-
96
-
97
-
98
-
99
-
100
-
101
-
102
-
103
-
104
-
105
-
106
-
107
-
108
-
109
-
110
-
111
-
112
-
113
-
114
-
115
-
116
-
117
-
118
-
119
-
120
-
121
-
122
-
123
-
124
-
125
-
126
-
127
-
128
-
129
-
130
-
131
-
132
-
133
-
134
-
135
-
136
-
137
-
138
-
139
-
140
-
141
-
142
-
143
-
144
-
145
-
146
-
147
-
148
-
149
-
150
-
151
-
152
-
153
-
154
-
155
-
156
-
157
-
158
-
159
-
160
-
161
-
162
-
163
-
164
-
165
-
166
-
167
-
168
-
169
-
170
-
171
-
172
-
173
-
174
-
175
-
176
-
177
-
178
-
179
-
180
-
181
-
182
-
183
-
184
-
185
-
186
-
187
-
188
-
189
-
190
-
191
-
192
-
193
-
194
-
195
-
196
-
197
-
198
-
199
-
200
-
201
-
202
-
203
-
204
-
205
-
206
-
207
-
208
-
209
-
210
-
211
-
212
-
213
-
214
-
215
-
216
-
217
-
218
-
219
-
220
-
221
-
222
-
223
-
224
-
225
-
226
-
227
-
228
-
229
-
230
-
231
-
232
-
233
-
234
-
235
-
236
-
237
-
238
-
239
-
240
-
241
-
242
-
243
-
244
-
245
-
246
-
247
-
248
-
249
-
250
-
251
-
252
-
253
-
254
-
255
-
256
-
257
-
258
-
259
-
260
-
261
-
262
-
263
-
264
-
265
-
266
-
267
-
268
-
269
-
270
-
271
-
272
-
273
-
274
-
275
-
276
-
277
-
278
-
279
-
280
-
281
-
282
-
283
-
284
-
285
-
286
-
287
-
288
-
289
-
290
-
291
-
292
-
293
-
294
-
295
-
296
-
297
-
298
-
299
-
300
-
301
-
302
-
303
-
304
-
305
-
306
-
307
-
308
-
309
-
310
-
311
-
312
-
313
 |
 |

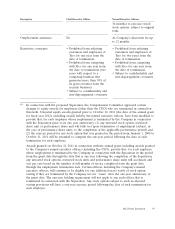
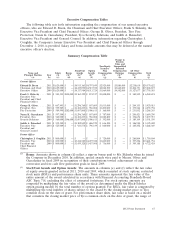
shares subject to such stock award, and the estimated probabilities of vesting outcomes. The value
of performance share units included in the table assumes target performance. The following
amounts represent the maximum potential performance share value by individual for fiscal 2010:
Mr. Breen—$9,826,325; Mr. Sklarsky—$1,792,294; Mr. Coughlin—$0; Mr. Oliver—$1,795,514;
Mr. Gursahaney—$1,795,514; Ms. Reinsdorf—$1,527,026.
Amounts in column (f) for Mr. Coughlin include the incremental fair value of certain
modifications made to outstanding options in connection with the fiscal 2010 equity grant. These
prior grants, which total 435,728 stock options, were made as part of the fiscal 2006, 2007 and 2009
annual equity incentive program. The awards were modified to provide that if Mr. Coughlin
remains employed by the Company on October 8, 2011, then the options will remain exercisable
throughout the entire ten-year period commencing on their grant dates, rather than the three-year
window that normally follows retirement, and that any unvested options outstanding on such date
(which would consist of 1⁄4 of the stock options granted in connection with the fiscal 2009 incentive
program) would immediately vest.
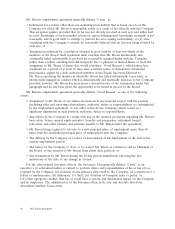
(3) Non-Equity Incentive Plan Compensation: The amounts reported in column (g) for each named
executive officer reflect annual cash incentive compensation for the applicable fiscal year. Annual
incentive compensation is discussed in further detail above under the heading ‘‘Elements of
Compensation—Annual Incentive Compensation.’’
(4) Change in Pension Value and Non-Qualified Deferred Compensation Earnings: The amounts
reported in column (h) for Mr. Breen reflect the aggregate increase in the actuarial present value
of his accumulated benefits under all pension plans during fiscal 2011, 2010 and 2009, determined
using interest rate and mortality rate assumptions consistent with those used in the Company’s
financial statements. Information regarding the pension plans is set forth in further detail below
following the ‘‘Pension Benefits’’ table.
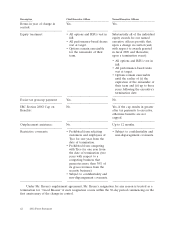
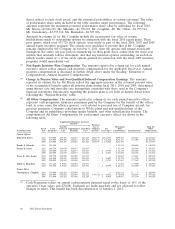
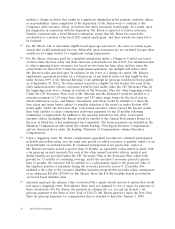
(5) All Other Compensation: The amounts reported in column (i) for each named executive officer
represent cash perquisites, insurance premiums paid by the Company for the benefit of the officer
(and, in some cases, the officer’s spouse), costs related to personal use of Company aircraft, tax
gross-up payments, Company contributions to 401(k) plans and non-qualified plans of the
Company and its subsidiaries providing similar benefits, and other miscellaneous benefits. The
components of All Other Compensation for each named executive officer are shown in the
following table.
Supplemental Executive Insurance
Benefits(b)
Personal
Variable Use of Retirement Total All
Fiscal Cash Universal Supplemental Long-Term Company Tax Plan Other
Named Executive Year Perquisite(a) Life Disability Care Aircraft(c) Gross-Ups(d) Contributions(e) Miscellaneous(f) Compensation
Current Officers
Edward D. Breen ..... 2011 $70,000 $50,405 $34,683 $15,429 $254,775 $1,512,738 $290,563 $10,017 $2,238,610
2010 $70,000 $50,405 $34,683 $15,429 $213,151 $ 841,566 $174,117 $ 5,000 $1,404,351
2009 $70,000 $50,405 $37,689 $15,428 $238,795 $ 478,964 $236,396 — $1,127,677
Franks S. Sklarsky .... 2011 $52,500 — — — — — $ 23,333 $64,669 $ 140,502
George R. Oliver ..... 2011 $60,750 $14,839 $14,837 $20,347 — — $ 83,380 $10,000 $ 204,153
2010 $60,000 $14,839 $14,837 $20,347 — $ 19,392 $ 36,149 $10,000 $ 175,564
2009 $60,000 $14,839 $14,837 $20,346 — $ 21,011 $ 84,049 $16,750 $ 231,832
Naren K. Gursahaney . . 2011 $59,750 $10,109 $15,008 $19,275 — — $ 86,665 $ 9,614 $ 200,421
2010 $56,000 $10,109 $15,008 $19,275 — $ 23,607 $ 43,475 $ 9,200 $ 176,674
2009 $56,000 $10,109 $15,008 $19,274 — $ 23,782 $ 57,567 $ 7,369 $ 189,109
Judith A. Reinsdorf . . . 2011 $53,250 $ 9,681 $12,762 $29,783 — — $ 71,604 $ 9,900 $ 186,980
2010 $52,500 $ 9,681 $12,762 $29,783 — $ 26,593 $ 44,133 $10,000 $ 185,452
Former Officer
Christopher J. Coughlin . 2011 $70,000 $28,262 $17,990 $21,211 — — $123,333 $ 8 $ 260,804
2010 $70,000 $28,262 $17,990 $21,211 $ 39,302 $ 43,471 $ 76,800 $10,190 $ 307,226
2009 $70,000 $28,262 $17,990 $21,210 — $ 39,959 $116,667 $15,100 $ 309,188
(a) Cash Perquisites reflect an annual cash perquisite payment equal to the lesser of 10% of the
executive’s base salary and $70,000. Payments are made quarterly and are adjusted to reflect
changes in salary. This benefit has been discontinued as of January 1, 2012.
68 2012 Proxy Statement