United Airlines 2007 Annual Report Download - page 78
Download and view the complete annual report
Please find page 78 of the 2007 United Airlines annual report below. You can navigate through the pages in the report by either clicking on the pages listed below, or by using the keyword search tool below to find specific information within the annual report.-
 1
1 -
2
-
3
-
4
-
5
-
6
-
7
-
8
-
9
-
10
-
11
-
12
-
13
-
14
-
15
-
16
-
17
-
18
-
19
-
20
-
21
-
22
-
23
-
24
-
25
-
26
-
27
-
28
-
29
-
30
-
31
-
32
-
33
-
34
-
35
-
36
-
37
-
38
-
39
-
40
-
41
-
42
-
43
-
44
-
45
-
46
-
47
-
48
-
49
-
50
-
51
-
52
-
53
-
54
-
55
-
56
-
57
-
58
-
59
-
60
-
61
-
62
-
63
-
64
-
65
-
66
-
67
-
 68
68 -
 69
69 -
 70
70 -
 71
71 -
 72
72 -
 73
73 -
 74
74 -
 75
75 -
 76
76 -
 77
77 -
 78
78 -
 79
79 -
 80
80 -
 81
81 -
 82
82 -
 83
83 -
 84
84 -
 85
85 -
 86
86 -
 87
87 -
 88
88 -
89
-
90
-
91
-
92
-
93
-
94
-
95
-
96
-
97
-
98
-
99
-
100
-
101
-
102
-
103
-
104
-
105
-
106
-
107
-
108
-
109
-
110
-
111
-
112
-
113
-
114
-
115
-
116
-
117
-
118
-
119
-
120
-
121
-
122
-
123
-
124
-
125
-
126
-
127
-
128
-
129
-
130
-
131
-
132
-
133
-
134
-
135
-
136
-
137
-
138
-
139
-
140
-
141
-
142
-
143
-
144
-
145
-
146
-
147
-
148
-
149
-
150
-
151
-
152
-
153
-
154
-
155
-
156
-
157
-
158
-
159
-
160
-
161
-
162
-
163
-
164
-
165
-
166
-
167
-
168
-
169
-
170
-
171
-
172
-
173
-
174
-
175
-
176
-
177
-
178
-
179
-
180
-
181
-
182
-
183
-
184
-
185
-
186
-
187
-
188
-
189
-
190
 |
 |

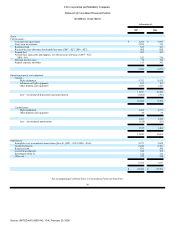
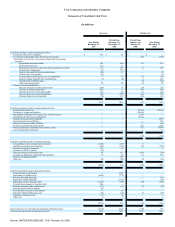
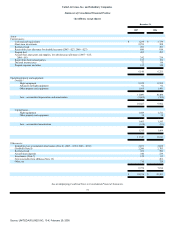
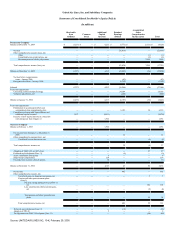
United Air Lines, Inc. and Subsidiary Companies
Statements of Consolidated Operations
(In millions)
Successor
Predecessor
Period from
February 1 to
December 31,
2006
Period from
January 1 to
January 31,
2006
Year Ended
December 31,
2007
Year Ended
December 31,
2005
Operating revenues:
Passenger—United Airlines $ 15,254 $ 13,293 $ 1,074 $ 12,914
Passenger—Regional affiliates 3,063 2,697 204 2,429
Cargo 770 694 56 729
Special operating items (Note 20) 45 — — —
Other operating revenues 999 1,196 120 1,232
20,131 17,880 1,454 17,304
Operating expenses:
Aircraft fuel 5,003 4,462 362 4,032
Salaries and related costs 4,257 3,907 358 4,014
Regional affiliates 2,941 2,596 228 2,746
Purchased services 1,346 1,146 97 1,049
Aircraft maintenance materials and
outside repairs 1,166 929
80 881
Depreciation and amortization 925 820 68 854
Landing fees and other rent 876 800 75 915
Distribution expenses (Note 2) 779 738 60 775
Aircraft rent 409 386 30 404
Cost of third party sales 312 604 63 656
Special operating items (Note 20) (44) (36) — 5
Other operating expenses 1,129 1,017 85 1,198
19,099 17,369 1,506 17,529
Earnings (loss) from operations 1,032 511 (52) (225)
Other income (expense):
Interest expense (660) (729) (42) (492)
Interest income 260 250 6 36
Interest capitalized 19 15 — (3)
Gain on sale of investment (Note 7) 41 — — —
Miscellaneous, net 1 11 — 76
(339) (453) (36) (383)
Earnings (loss) before reorganization items,
income taxes and equity in earnings of
affiliates 693 58
(88) (608)
Reorganization items, net (Note 1) — — 22,709 (20,432)
Earnings (loss) before income taxes and
equity in earnings of affiliates 693 58
22,621 (21,040)
Income tax expense 296 29 — —
Earnings (loss) before equity in earnings of
affiliates 397 29
22,621 (21,040)
Equity in earnings of affiliates, net of tax 5 3 5 4
Net income (loss) $ 402 $ 32 $ 22,626 $ (21,036)
See accompanying Combined Notes to Consolidated Financial Statements.
74
Source: UNITED AIR LINES INC, 10-K, February 29, 2008