United Airlines 2007 Annual Report Download - page 35
Download and view the complete annual report
Please find page 35 of the 2007 United Airlines annual report below. You can navigate through the pages in the report by either clicking on the pages listed below, or by using the keyword search tool below to find specific information within the annual report.-
 1
1 -
2
-
3
-
4
-
5
-
6
-
7
-
8
-
9
-
10
-
11
-
12
-
13
-
14
-
15
-
16
-
17
-
18
-
19
-
20
-
21
-
22
-
23
-
24
-
 25
25 -
 26
26 -
 27
27 -
 28
28 -
 29
29 -
 30
30 -
 31
31 -
 32
32 -
 33
33 -
 34
34 -
 35
35 -
 36
36 -
 37
37 -
 38
38 -
 39
39 -
 40
40 -
 41
41 -
 42
42 -
 43
43 -
 44
44 -
 45
45 -
46
-
47
-
48
-
49
-
50
-
51
-
52
-
53
-
54
-
55
-
56
-
57
-
58
-
59
-
60
-
61
-
62
-
63
-
64
-
65
-
66
-
67
-
68
-
69
-
70
-
71
-
72
-
73
-
74
-
75
-
76
-
77
-
78
-
79
-
80
-
81
-
82
-
83
-
84
-
85
-
86
-
87
-
88
-
89
-
90
-
91
-
92
-
93
-
94
-
95
-
96
-
97
-
98
-
99
-
100
-
101
-
102
-
103
-
104
-
105
-
106
-
107
-
108
-
109
-
110
-
111
-
112
-
113
-
114
-
115
-
116
-
117
-
118
-
119
-
120
-
121
-
122
-
123
-
124
-
125
-
126
-
127
-
128
-
129
-
130
-
131
-
132
-
133
-
134
-
135
-
136
-
137
-
138
-
139
-
140
-
141
-
142
-
143
-
144
-
145
-
146
-
147
-
148
-
149
-
150
-
151
-
152
-
153
-
154
-
155
-
156
-
157
-
158
-
159
-
160
-
161
-
162
-
163
-
164
-
165
-
166
-
167
-
168
-
169
-
170
-
171
-
172
-
173
-
174
-
175
-
176
-
177
-
178
-
179
-
180
-
181
-
182
-
183
-
184
-
185
-
186
-
187
-
188
-
189
-
190
 |
 |

For purposes of providing management's year-over-year discussions of the results of operations, management has compared the Successor Company results
for the year ended December 31, 2007 to the combined 2006 annual results, consisting of the Successor Company's results for the eleven months ended
December 31, 2006 and the Predecessor Company's January 2006 results, and to the Predecessor Company's annual 2005 results. The presentation of results for
the combined twelve month period of 2006 are non-GAAP measures. However, management believes that these year-over-year comparisons of the results of
operations provide management and investors a useful basis of comparison to the full years of 2007 and 2005. The discussion of financial results below includes
a discussion of certain bankruptcy related matters that the Company has classified as special items in its Statements of Consolidated Operations. These items
have been classified as special because they are directly related to the resolution of bankruptcy administrative claims and are not indicative of the Company's
ongoing financial performance.
The air travel business is subject to seasonal fluctuations and historically, the Company's results of operations are better in the second and third quarters as
compared to the first and fourth quarters of each year, since our first and fourth quarter results normally reflect weaker travel demand. The Company's results of
operations can be impacted by adverse weather, air traffic control delays and other factors in any period.
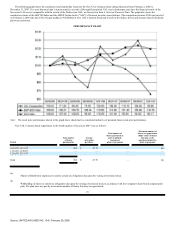
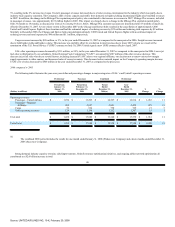
The table below presents certain financial statement items to provide an overview of UAL 's and United's financial performance for the three years ended
December 31, 2007.
Successor
Combined
Successor
Predecessor
Predecessor
(In millions)
Year Ended
December 31,
2007
Twelve Months
Ended
December 31,
2006(a)
Period from
February 1 to
December 31,
2006
Period from
January 1 to
January 31,
2006
Year Ended
December 31,
2005
Earnings (loss) before reorganization
items, income taxes and equity
earnings in affiliates $ 695 $ (45) $ 43 $ (88) $ (579)
Reorganization items, net — 22,934 — 22,934 (20,601)
Income taxes (297) (21) (21) — —
Equity in earnings of affiliates 5 8 3 5 4
UAL net income (loss) $ 403 $ 22,876 $ 25 $ 22,851 $ (21,176)
United net income (loss) $ 402 $ 22,658 $ 32 $ 22,626 $ (21,036)
(a)
The combined period includes the results for one month ended January 31, 2006 (Predecessor Company) and eleven months ended December 31, 2006
(Successor Company).
UAL
UAL 's 2007 income before reorganization items, income taxes and equity in earnings of affiliates improved by $740 million and $1.3 billion as compared
to 2006 and 2005, respectively. The following items highlight some of the more significant variances in the 2007 period as compared to 2006 and 2005. For a
more detailed discussion of these items and additional factors impacting our financial performance see Results of Operations, below.
•
The Company increased its annual mainline passenger unit revenue ("PRASM") by 7% between 2007 and 2006, and by 9% between 2006
and 2005, through continued capacity discipline and revenue execution. Including special items, 2007 passenger revenues increased by
$1.1 billion and $3.0 billion as compared to 2006 and 2005, respectively. In 2007, the change in the Mileage Plus expiration period had a
significant impact on passenger revenues, as discussed below.
34
Source: UNITED AIR LINES INC, 10-K, February 29, 2008