United Airlines 2007 Annual Report Download - page 41
Download and view the complete annual report
Please find page 41 of the 2007 United Airlines annual report below. You can navigate through the pages in the report by either clicking on the pages listed below, or by using the keyword search tool below to find specific information within the annual report.-
 1
1 -
2
-
3
-
4
-
5
-
6
-
7
-
8
-
9
-
10
-
11
-
12
-
13
-
14
-
15
-
16
-
17
-
18
-
19
-
20
-
21
-
22
-
23
-
24
-
25
-
26
-
27
-
28
-
29
-
30
-
 31
31 -
 32
32 -
 33
33 -
 34
34 -
 35
35 -
 36
36 -
 37
37 -
 38
38 -
 39
39 -
 40
40 -
 41
41 -
 42
42 -
 43
43 -
 44
44 -
 45
45 -
 46
46 -
 47
47 -
 48
48 -
 49
49 -
 50
50 -
 51
51 -
52
-
53
-
54
-
55
-
56
-
57
-
58
-
59
-
60
-
61
-
62
-
63
-
64
-
65
-
66
-
67
-
68
-
69
-
70
-
71
-
72
-
73
-
74
-
75
-
76
-
77
-
78
-
79
-
80
-
81
-
82
-
83
-
84
-
85
-
86
-
87
-
88
-
89
-
90
-
91
-
92
-
93
-
94
-
95
-
96
-
97
-
98
-
99
-
100
-
101
-
102
-
103
-
104
-
105
-
106
-
107
-
108
-
109
-
110
-
111
-
112
-
113
-
114
-
115
-
116
-
117
-
118
-
119
-
120
-
121
-
122
-
123
-
124
-
125
-
126
-
127
-
128
-
129
-
130
-
131
-
132
-
133
-
134
-
135
-
136
-
137
-
138
-
139
-
140
-
141
-
142
-
143
-
144
-
145
-
146
-
147
-
148
-
149
-
150
-
151
-
152
-
153
-
154
-
155
-
156
-
157
-
158
-
159
-
160
-
161
-
162
-
163
-
164
-
165
-
166
-
167
-
168
-
169
-
170
-
171
-
172
-
173
-
174
-
175
-
176
-
177
-
178
-
179
-
180
-
181
-
182
-
183
-
184
-
185
-
186
-
187
-
188
-
189
-
190
 |
 |

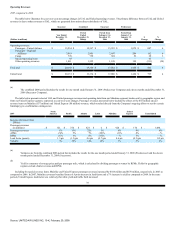
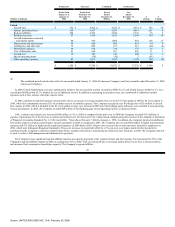
3% resulting in the 6% increase in revenue. Overall, passenger revenues increased due to a better revenue environment for the industry which was partly due to
industry-wide capacity constraint. The Company's shift of some capacity and traffic from domestic to higher yielding international flights also benefited revenues
in 2007. In addition, the change in the Mileage Plus expiration period policy also contributed to the increase in revenues in 2007. Mileage Plus revenue, included
in passenger revenues, was approximately $169 million higher in 2007. This impact was largely due to a change in the Mileage Plus expiration period policy
from 36 months to 18 months, as discussed in Critical Accounting Policies, below. Mileage Plus customer accounts are deactivated after 18 months of inactivity,
effective December 31, 2007. Severe winter storms in December 2007 at the Chicago and Denver hubs resulted in the cancellation of approximately 6,400
United and United Express flights at these locations and had the estimated impact of reducing revenue by $25 million and reducing total expenses by $2 million.
Similarly in December 2006, the Chicago and Denver hubs canceled approximately 3,900 United and United Express flights with an estimated impact of
reducing revenue and total expenses by $40 million and $11 million, respectively.
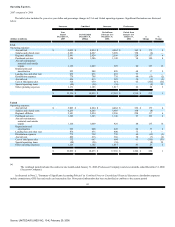
Cargo revenues increased by $20 million, or 3%, in the year ended December 31, 2007 as compared to the same period in 2006. Freight revenue increased
due to both higher yields and higher volume. This increase was partially offset by a reduction in mail revenue due to lower 2007 volume as a result of the
termination of the U.S. Postal Service ("USPS") contract on June 30, 2006. United signed a new USPS contract effective April, 2007.
UAL other operating revenues decreased by $311 million, or 24%, in the year ended December 31, 2007 as compared to the same period in 2006. Lower jet
fuel sales to third parties by our subsidiary, United Aviation Fuels Corporation ("UAFC") accounted for $307 million of the other revenue decrease. This
decrease in jet fuel sales was due to several factors, including decreased UAFC sales to our regional affiliates, our decision not to renew various low margin
supply agreements to other carriers, and decreased sales of excess inventory. This decrease had no material impact on the Company's operating margin, because
UAFC cost of sales decreased by $306 million in the year ended December 31, 2007 as compared to the prior year.
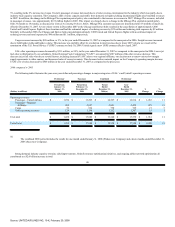
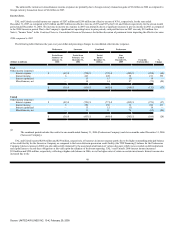
2006 compared to 2005
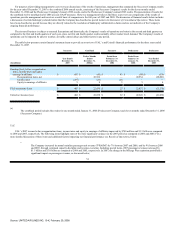
The following table illustrates the year-over-year dollar and percentage changes in major categories of UAL 's and United's operating revenues.
Predecessor
Successor
Combined
Predecessor
(Dollars in millions)
Period from
January 1 to
January 31,
2006
Period from
February 1 to
December 31,
2006
Period
Ended
December 31,
2006(a)
Year
Ended
December 31,
2005
$
Change
%
Change
Operating revenues:
Passenger—United Airlines $ 1,074 $ 13,293 $ 14,367 $ 12,914 $ 1,453 11
Passenger—Regional
Affiliates 204 2,697 2,901 2,429 472 19
Cargo 56 694 750 729 21 3
Other operating revenues 124 1,198 1,322 1,307 15 1
UAL total $ 1,458 $ 17,882 $ 19,340 $ 17,379 $ 1,961 11
United total $ 1,454 $ 17,880 $ 19,334 $ 17,304 $ 2,030 12
(a)
The combined 2006 period includes the results for one month ended January 31, 2006 (Predecessor Company) and eleven months ended December 31,
2006 (Successor Company).
Strong demand, industry capacity restraint, yield improvements, United's resource optimization initiatives, and ongoing airline network optimization all
contributed to a $2.0 billion increase in total
40
Source: UNITED AIR LINES INC, 10-K, February 29, 2008