United Airlines 2007 Annual Report Download - page 45
Download and view the complete annual report
Please find page 45 of the 2007 United Airlines annual report below. You can navigate through the pages in the report by either clicking on the pages listed below, or by using the keyword search tool below to find specific information within the annual report.-
 1
1 -
2
-
3
-
4
-
5
-
6
-
7
-
8
-
9
-
10
-
11
-
12
-
13
-
14
-
15
-
16
-
17
-
18
-
19
-
20
-
21
-
22
-
23
-
24
-
25
-
26
-
27
-
28
-
29
-
30
-
31
-
32
-
33
-
34
-
 35
35 -
 36
36 -
 37
37 -
 38
38 -
 39
39 -
 40
40 -
 41
41 -
 42
42 -
 43
43 -
 44
44 -
 45
45 -
 46
46 -
 47
47 -
 48
48 -
 49
49 -
 50
50 -
 51
51 -
 52
52 -
 53
53 -
 54
54 -
 55
55 -
56
-
57
-
58
-
59
-
60
-
61
-
62
-
63
-
64
-
65
-
66
-
67
-
68
-
69
-
70
-
71
-
72
-
73
-
74
-
75
-
76
-
77
-
78
-
79
-
80
-
81
-
82
-
83
-
84
-
85
-
86
-
87
-
88
-
89
-
90
-
91
-
92
-
93
-
94
-
95
-
96
-
97
-
98
-
99
-
100
-
101
-
102
-
103
-
104
-
105
-
106
-
107
-
108
-
109
-
110
-
111
-
112
-
113
-
114
-
115
-
116
-
117
-
118
-
119
-
120
-
121
-
122
-
123
-
124
-
125
-
126
-
127
-
128
-
129
-
130
-
131
-
132
-
133
-
134
-
135
-
136
-
137
-
138
-
139
-
140
-
141
-
142
-
143
-
144
-
145
-
146
-
147
-
148
-
149
-
150
-
151
-
152
-
153
-
154
-
155
-
156
-
157
-
158
-
159
-
160
-
161
-
162
-
163
-
164
-
165
-
166
-
167
-
168
-
169
-
170
-
171
-
172
-
173
-
174
-
175
-
176
-
177
-
178
-
179
-
180
-
181
-
182
-
183
-
184
-
185
-
186
-
187
-
188
-
189
-
190
 |
 |
in 2006 to $779 million in 2007. This decrease was due to cost savings realized as the Company continues to drive reductions across the full spectrum of costs of
sale. Impact areas included renegotiation of contracts with various channel providers, rationalization of commission plans and programs, and continued emphasis
on movement of customer purchases toward lower cost channels including online channels. Such efforts resulted in a 9% year-over-year reduction in GDS fees
and commissions.
The decrease in cost of sales in 2007 as compared to 2006 was primarily due to lower UAFC third party fuel sales of $307 million as described in the
discussion of revenue variances above.
Special items of $44 million in the year ended December 31, 2007 include a $30 million benefit due to the reduction in recorded accruals for pending
bankruptcy litigation related to our SFO and LAX municipal bond obligations and a $14 million benefit due to the Company's ongoing efforts to resolve certain
other bankruptcy pre-confirmation contingencies. In the eleven months ended December 31, 2006, special items of $36 million included a $12 million benefit to
adjust the Company's recorded obligation for the SFO and LAX municipal bonds and a $24 million benefit related to pre-confirmation pension matters. The 2007
and 2006 special items resulted from revised estimates of the probable amount to be allowed by the Bankruptcy Court, and were recorded in accordance with
AICPA Practice Bulletin 11, Accounting for Preconfirmation Contingencies in Fresh-Start Reporting. See Note 1, "Voluntary Reorganization Under Chapter 11"
and Note 20, "Special Items" in the Combined Notes to Consolidated Financial Statements for further information on these special items and pending matters.
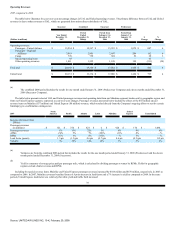
2006 compared to 2005
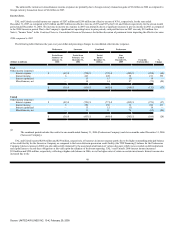
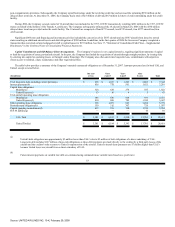
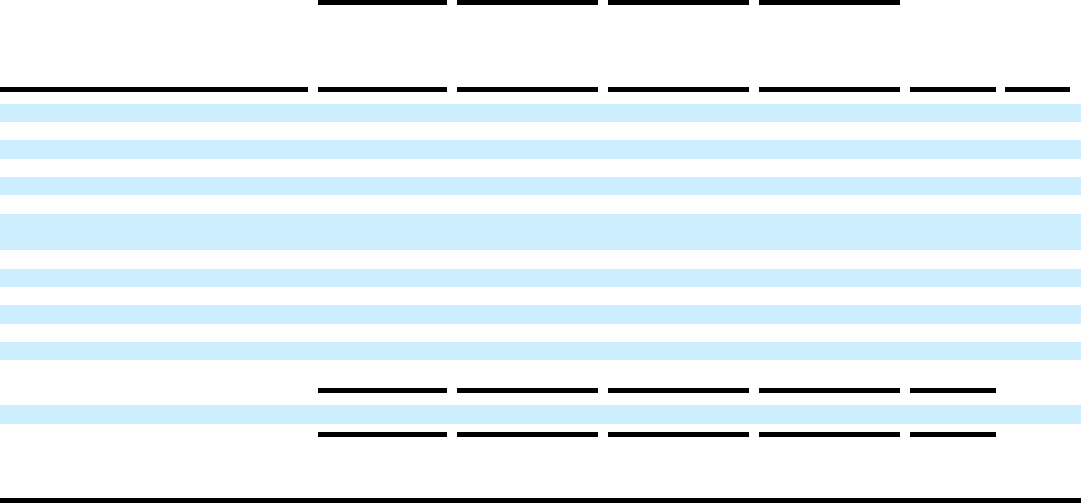
The table below includes the year-over-year dollar and percentage changes in operating expenses. Significant fluctuations are discussed below.
Predecessor
Successor
Combined
Predecessor
(Dollars in millions)
Period from
January 1 to
January 31,
2006
Period from
February 1 to
December 31,
2006
Period
Ended
December 31,
2006(a)
Year
Ended
December 31,
2005
$
Change
%
Change
UAL
Operating expenses:
Aircraft fuel $ 362 $ 4,462 $ 4,824 $ 4,032 $ 792 20
Salaries and related costs 358 3,909 4,267 4,027 240 6
Regional affiliates 228 2,596 2,824 2,746 78 3
Purchased services 98 1,148 1,246 1,054 192 18
Aircraft maintenance materials
and outside repairs 80 929 1,009 881 128 15
Depreciation and amortization 68 820 888 856 32 4
Landing fees and other rent 75 801 876 915 (39) (4)
Distribution expenses 60 738 798 775 23 3
Cost of third party sales 65 614 679 685 (6) (1)
Aircraft rent 30 385 415 402 13 3
Special operating items — (36) (36) 18 (54) —
Other operating expenses 86 1,017 1,103 1,207 (104) (9)
$ 1,510 $ 17,383 $ 18,893 $ 17,598 $ 1,295 7
44
Source: UNITED AIR LINES INC, 10-K, February 29, 2008