United Airlines 2007 Annual Report Download - page 47
Download and view the complete annual report
Please find page 47 of the 2007 United Airlines annual report below. You can navigate through the pages in the report by either clicking on the pages listed below, or by using the keyword search tool below to find specific information within the annual report.-
 1
1 -
2
-
3
-
4
-
5
-
6
-
7
-
8
-
9
-
10
-
11
-
12
-
13
-
14
-
15
-
16
-
17
-
18
-
19
-
20
-
21
-
22
-
23
-
24
-
25
-
26
-
27
-
28
-
29
-
30
-
31
-
32
-
33
-
34
-
35
-
36
-
 37
37 -
 38
38 -
 39
39 -
 40
40 -
 41
41 -
 42
42 -
 43
43 -
 44
44 -
 45
45 -
 46
46 -
 47
47 -
 48
48 -
 49
49 -
 50
50 -
 51
51 -
 52
52 -
 53
53 -
 54
54 -
 55
55 -
 56
56 -
 57
57 -
58
-
59
-
60
-
61
-
62
-
63
-
64
-
65
-
66
-
67
-
68
-
69
-
70
-
71
-
72
-
73
-
74
-
75
-
76
-
77
-
78
-
79
-
80
-
81
-
82
-
83
-
84
-
85
-
86
-
87
-
88
-
89
-
90
-
91
-
92
-
93
-
94
-
95
-
96
-
97
-
98
-
99
-
100
-
101
-
102
-
103
-
104
-
105
-
106
-
107
-
108
-
109
-
110
-
111
-
112
-
113
-
114
-
115
-
116
-
117
-
118
-
119
-
120
-
121
-
122
-
123
-
124
-
125
-
126
-
127
-
128
-
129
-
130
-
131
-
132
-
133
-
134
-
135
-
136
-
137
-
138
-
139
-
140
-
141
-
142
-
143
-
144
-
145
-
146
-
147
-
148
-
149
-
150
-
151
-
152
-
153
-
154
-
155
-
156
-
157
-
158
-
159
-
160
-
161
-
162
-
163
-
164
-
165
-
166
-
167
-
168
-
169
-
170
-
171
-
172
-
173
-
174
-
175
-
176
-
177
-
178
-
179
-
180
-
181
-
182
-
183
-
184
-
185
-
186
-
187
-
188
-
189
-
190
 |
 |

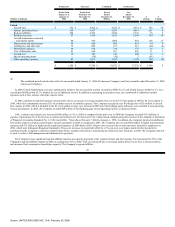
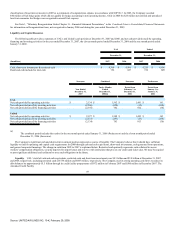
expense increased only 3% despite a 9% increase in capacity due to the benefits of restructured regional carrier capacity agreements in 2006 along with regional
carrier network optimization and the replacement of some 50-seat regional jets with 70-seat regional jets. The 3% increase in regional affiliates expense includes
an 18% increase in fuel costs. See Note 2(j), "Summary of Significant Accounting Policies—United Express," in the Combined Notes to Consolidated Financial
Statements for further discussion of the Regional affiliates expense.
The Company's purchased services increased 18% in 2006, as compared to 2005, primarily due to an increase of approximately $120 million in outsourcing
costs for various non-core work activities; as well as a $31 million increase in certain professional fees, which were classified as reorganization expenses by the
Predecessor Company. The offsetting benefits of higher outsourcing costs are reflected in a 4% reduction in manpower associated with the 6% labor productivity
improvement noted for salaries and related costs.
In 2006, aircraft maintenance materials and outside repairs expense increased $128 million, or 15%, from 2005 primarily due to engine-related maintenance
rate increases as well as increased repair volume.
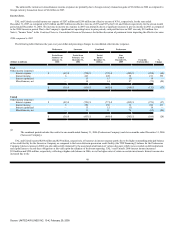
As discussed in Note 1, "Voluntary Reorganization Under Chapter 11—Fresh-Start Reporting," in the Combined Notes to Consolidated Financial
Statements, the Company revalued its assets and liabilities to estimated fair values. In 2006, UAL 's amortization expense increased $162 million due to the
recognition of $453 million of additional definite-lived intangible assets; however, this increase was offset by decreased depreciation expense from fresh-start
reporting adjustments that significantly reduced depreciable tangible asset book values to fair value. The impact of the decrease in tangible asset valuation was
significant as depreciation and amortization only increased $32 million despite the $162 million increase in intangible asset amortization and incremental
depreciation on post-emergence property additions. The fresh-start impacts on United's depreciation and amortization expense were not materially different than
the UAL impacts.
The Company's distribution expenses, which include commissions, GDS fees and credit card fees, increased $23 million, or 3%, year-over-year primarily
due to a $24 million increase in credit card fees due to higher passenger revenues.
UAL 's and United's other operating expenses decreased $104 million and $96 million in 2006, as compared to 2005, respectively. The adoption of
fresh-start reporting, which included the revaluation of the Company's frequent flyer obligation to estimated fair value and the change in accounting policy to a
deferred revenue model for the Successor Company reduced other expense by an estimated $27 million. For periods on or after February 1, 2006, adjustments to
the frequent flyer obligation are recorded to passenger and other operating revenues, whereas periodic adjustments under the Predecessor Company's incremental
cost basis were recognized in both operating revenues and other operating expense. See "Critical Accounting Policies," below, for further details. Various cost
savings initiatives also reduced the Company's costs in 2006 as compared to 2005.
In 2006, the Company recognized a net benefit of $36 million to operating expense resulting from the resolution of preconfirmation contingencies for the
estimated liability for SFO and LAX municipal bond obligations, and favorable adjustments to preconfirmation contingencies related to the pilots non-qualified
pension plan. In 2005, UAL and United recognized charges of $18 million and $5 million, respectively, for aircraft impairments related to the planned
accelerated retirement of certain aircraft.
46
Source: UNITED AIR LINES INC, 10-K, February 29, 2008