United Airlines 2007 Annual Report Download - page 31
Download and view the complete annual report
Please find page 31 of the 2007 United Airlines annual report below. You can navigate through the pages in the report by either clicking on the pages listed below, or by using the keyword search tool below to find specific information within the annual report.-
 1
1 -
2
-
3
-
4
-
5
-
6
-
7
-
8
-
9
-
10
-
11
-
12
-
13
-
14
-
15
-
16
-
17
-
18
-
19
-
20
-
 21
21 -
 22
22 -
 23
23 -
 24
24 -
 25
25 -
 26
26 -
 27
27 -
 28
28 -
 29
29 -
 30
30 -
 31
31 -
 32
32 -
 33
33 -
 34
34 -
 35
35 -
 36
36 -
 37
37 -
 38
38 -
 39
39 -
 40
40 -
 41
41 -
42
-
43
-
44
-
45
-
46
-
47
-
48
-
49
-
50
-
51
-
52
-
53
-
54
-
55
-
56
-
57
-
58
-
59
-
60
-
61
-
62
-
63
-
64
-
65
-
66
-
67
-
68
-
69
-
70
-
71
-
72
-
73
-
74
-
75
-
76
-
77
-
78
-
79
-
80
-
81
-
82
-
83
-
84
-
85
-
86
-
87
-
88
-
89
-
90
-
91
-
92
-
93
-
94
-
95
-
96
-
97
-
98
-
99
-
100
-
101
-
102
-
103
-
104
-
105
-
106
-
107
-
108
-
109
-
110
-
111
-
112
-
113
-
114
-
115
-
116
-
117
-
118
-
119
-
120
-
121
-
122
-
123
-
124
-
125
-
126
-
127
-
128
-
129
-
130
-
131
-
132
-
133
-
134
-
135
-
136
-
137
-
138
-
139
-
140
-
141
-
142
-
143
-
144
-
145
-
146
-
147
-
148
-
149
-
150
-
151
-
152
-
153
-
154
-
155
-
156
-
157
-
158
-
159
-
160
-
161
-
162
-
163
-
164
-
165
-
166
-
167
-
168
-
169
-
170
-
171
-
172
-
173
-
174
-
175
-
176
-
177
-
178
-
179
-
180
-
181
-
182
-
183
-
184
-
185
-
186
-
187
-
188
-
189
-
190
 |
 |
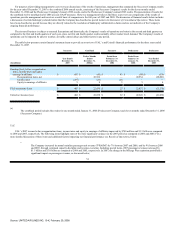
ITEM 6. SELECTED FINANCIAL DATA.
In connection with its emergence from Chapter 11 bankruptcy protection, the Company adopted fresh-start reporting in accordance with SOP 90-7 and in
conformity with accounting principles generally accepted in the United States of America ("GAAP"). As a result of the adoption of fresh-start reporting, the
financial statements prior to February 1, 2006 are not comparable with the financial statements after February 1, 2006. References to "Successor Company" refer
to UAL and United on or after February 1, 2006, after giving effect to the adoption of fresh-start reporting. References to "Predecessor Company" refer to UAL
and United prior to February 1, 2006.
Successor
Predecessor
Period from
February 1 to
December 31,
2006
Period from
January 1 to
January 31,
2006
Year Ended December 31,
Year Ended
December 31,
2007
(In millions, except rates)
2005
2004
2003
Income Statement Data:
UAL
Operating revenues $ 20,143 $ 17,882 $ 1,458 $ 17,379 $ 16,391 $ 14,928
Operating expenses 19,106 17,383 1,510 17,598 17,245 16,288
Fuel expenses—Mainline 5,003 4,462 362 4,032 2,943 2,072
Reorganization (income) expense — — (22,934) 20,601 611 1,173
Net income (loss)(a) 403 25 22,851 (21,176) (1,721) (2,808)
Basic earnings (loss) per share 3.34 0.14 196.61 (182.29) (15.25) (27.36)
Diluted earnings (loss) per share 2.79 0.14 196.61 (182.29) (15.25) (27.36)
Cash distribution declared per common
share(b) 2.15 —
— — — —
United
Operating revenues $ 20,131 $ 17,880 $ 1,454 $ 17,304 $ 16,413 $ 14,933
Operating expenses 19,099 17,369 1,506 17,529 17,217 16,246
Fuel expenses—Mainline 5,003 4,462 362 4,032 2,943 2,072
Reorganization (income) expense — — (22,709) 20,432 611 1,174
Net income (loss)(a) 402 32 22,626 (21,036) (1,679) (2,777)
Balance Sheet Data at period-end:
UAL
Total assets $ 24,220 $ 25,369 $ 19,555 $ 19,342 $ 20,705 $ 21,979
Long-term debt and capital lease obligations,
including current portion 8,449 10,600
1,432 1,433 1,204 852
Liabilities subject to compromise — — 36,336 35,016 16,035 13,964
United
Total assets $ 24,236 $ 25,581 $ 19,595 $ 19,396 $ 20,719 $ 21,959
Long-term debt and capital lease obligations,
including current portion 8,446 10,596
1,432 1,433 1,204 852
Liabilities subject to compromise — — 36,379 35,060 16,161 14,090
Mainline Operating Statistics(c):
UAL and United
Revenue passengers 68 69 (c) 67 71 66
RPMs 117,399 117,470 (c) 114,272 115,198 104,464
ASMs 141,890 143,095 (c) 140,300 145,361 136,630
Passenger load factor 82.7% 82.1% (c) 81.4% 79.2% 76.5%
Yield(d) 12.99¢ 12.19¢ (c) 11.25¢ 10.83¢ 10.79¢
Passenger revenue per ASM ("PRASM")(e) 10.78¢ 10.04¢ (c) 9.20¢ 8.63¢ 8.32¢
Operating revenue per ASM ("RASM")(f) 12.03¢ 11.49¢ (c) 10.66¢ 9.95¢ 9.81¢
Operating expense per ASM ("CASM")(g) 11.39¢ 11.23¢ (c) 10.59¢ 10.20¢ 10.52¢
Fuel gallons consumed 2,292 2,290 (c) 2,250 2,349 2,202
Average price per gallon of jet fuel, including
tax and hedge impact 218.3¢ 210.7¢
(c) 179.2¢ 125.3¢ 94.1¢
(a)
Net income (loss) was significantly impacted in the Predecessor periods due to the reorganization items related to the bankruptcy restructuring.
(b)
Paid in January 2008.
(c)
Mainline operations exclude the operations of independent regional carriers operating as United Express. Statistics included in the 2006 Successor period were calculated using the
combined results of the Successor period from February 1 to December 31, 2006 and the Predecessor January 2006 period.
(d)
Yield is Mainline passenger revenue excluding industry and employee discounted fares per RPM.
(e)
PRASM is Mainline passenger revenue per ASM.
(f)
RASM is operating revenues excluding United Express passenger revenue per ASM.
(g)
CASM is operating expenses excluding United Express operating expenses per ASM.
30
Source: UNITED AIR LINES INC, 10-K, February 29, 2008