United Airlines 2007 Annual Report Download - page 110
Download and view the complete annual report
Please find page 110 of the 2007 United Airlines annual report below. You can navigate through the pages in the report by either clicking on the pages listed below, or by using the keyword search tool below to find specific information within the annual report.-
 1
1 -
2
-
3
-
4
-
5
-
6
-
7
-
8
-
9
-
10
-
11
-
12
-
13
-
14
-
15
-
16
-
17
-
18
-
19
-
20
-
21
-
22
-
23
-
24
-
25
-
26
-
27
-
28
-
29
-
30
-
31
-
32
-
33
-
34
-
35
-
36
-
37
-
38
-
39
-
40
-
41
-
42
-
43
-
44
-
45
-
46
-
47
-
48
-
49
-
50
-
51
-
52
-
53
-
54
-
55
-
56
-
57
-
58
-
59
-
60
-
61
-
62
-
63
-
64
-
65
-
66
-
67
-
68
-
69
-
70
-
71
-
72
-
73
-
74
-
75
-
76
-
77
-
78
-
79
-
80
-
81
-
82
-
83
-
84
-
85
-
86
-
87
-
88
-
89
-
90
-
91
-
92
-
93
-
94
-
95
-
96
-
97
-
98
-
99
-
 100
100 -
 101
101 -
 102
102 -
 103
103 -
 104
104 -
 105
105 -
 106
106 -
 107
107 -
 108
108 -
 109
109 -
 110
110 -
 111
111 -
 112
112 -
 113
113 -
 114
114 -
 115
115 -
 116
116 -
 117
117 -
 118
118 -
 119
119 -
 120
120 -
121
-
122
-
123
-
124
-
125
-
126
-
127
-
128
-
129
-
130
-
131
-
132
-
133
-
134
-
135
-
136
-
137
-
138
-
139
-
140
-
141
-
142
-
143
-
144
-
145
-
146
-
147
-
148
-
149
-
150
-
151
-
152
-
153
-
154
-
155
-
156
-
157
-
158
-
159
-
160
-
161
-
162
-
163
-
164
-
165
-
166
-
167
-
168
-
169
-
170
-
171
-
172
-
173
-
174
-
175
-
176
-
177
-
178
-
179
-
180
-
181
-
182
-
183
-
184
-
185
-
186
-
187
-
188
-
189
-
190
 |
 |

UAL Corporation and Subsidiary Companies
Combined Notes to Consolidated Financial Statements (Continued)
(5) Share-Based Compensation Plans (Continued)
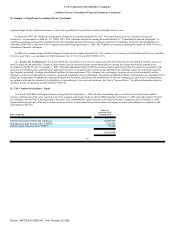
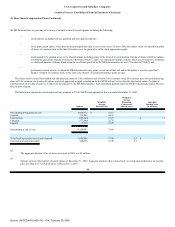
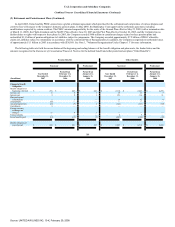
The following table provides additional information for options granted in each period:
Weighted-average fair value assumptions:
Year Ended
December 31,
2007
Period from
February 1 to
December 31, 2006
Risk-free interest rate 3.4 - 5.0% 4.4 - 5.1%
Dividend yield 0% 0%
Expected market price volatility of UAL common
stock 55% 55 - 57%
Expected life of options (years) 5.8 - 6.2 5.0 - 6.2
Weighted-average fair value $ 25.13 $ 21.37
The fair value of options was determined at the grant date using a Black-Scholes option pricing model, which requires the Company to make several
assumptions. The risk-free interest rate is based on the U.S. Treasury yield curve in effect for the expected term of the option at the time of grant. The dividend
yield on UAL's common stock was assumed to be zero since UAL did not have any plans to pay dividends at the time of the option grants.
The volatility assumptions were based upon historical volatilities of comparable airlines whose shares are traded using daily stock price returns equivalent to
the contractual term of the option. Since the new UAL common stock only began trading in February 2006, the historical volatility data for UAL was not
considered adequate to determine expected volatility. The Company did consider implied volatility data for both UAL and comparable airlines, using current
exchange-traded options.
The expected life of the options was determined based upon a simplified assumption that the option will be exercised evenly from vesting to expiration
under the transitional guidance of Staff Accounting Bulletin No. 107, Topic 14, Share-Based Payments. The stock options typically vest over a four year period,
except for awards to retirement-eligible employees, which are considered vested at the grant date.
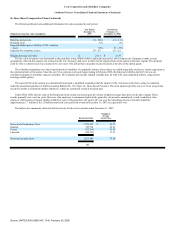
Under SFAS 123R, the fair value of the Restricted Stock awards was based upon the volume weighted-average share price on the date of grant. These
awards generally vest over four years. However, if an employee is retirement eligible at the grant date, the award is immediately vested. In addition, if an
employee will become retirement eligible within four years of the grant date, the award will vest over the remaining period to retirement eligibility.
Approximately 1.7 million of the 2.0 million nonvested restricted stock awards at December 31, 2007 are expected to vest.
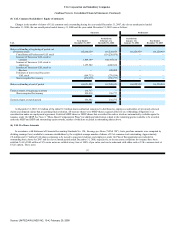
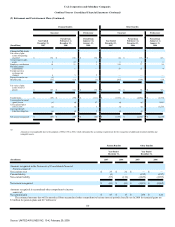
The table below summarizes Restricted Stock activity for the twelve months ended December 31, 2007:
Restricted Stock
Weighted-
Average
Grant Price
Nonvested at beginning of year 2,712,787 $ 36.71
Granted 165,734 43.61
Vested (755,799) 36.83
Canceled (104,733) 37.23
Nonvested at end of year 2,017,989 37.20
101
Source: UNITED AIR LINES INC, 10-K, February 29, 2008