United Airlines 2007 Annual Report Download - page 46
Download and view the complete annual report
Please find page 46 of the 2007 United Airlines annual report below. You can navigate through the pages in the report by either clicking on the pages listed below, or by using the keyword search tool below to find specific information within the annual report.-
 1
1 -
2
-
3
-
4
-
5
-
6
-
7
-
8
-
9
-
10
-
11
-
12
-
13
-
14
-
15
-
16
-
17
-
18
-
19
-
20
-
21
-
22
-
23
-
24
-
25
-
26
-
27
-
28
-
29
-
30
-
31
-
32
-
33
-
34
-
35
-
 36
36 -
 37
37 -
 38
38 -
 39
39 -
 40
40 -
 41
41 -
 42
42 -
 43
43 -
 44
44 -
 45
45 -
 46
46 -
 47
47 -
 48
48 -
 49
49 -
 50
50 -
 51
51 -
 52
52 -
 53
53 -
 54
54 -
 55
55 -
 56
56 -
57
-
58
-
59
-
60
-
61
-
62
-
63
-
64
-
65
-
66
-
67
-
68
-
69
-
70
-
71
-
72
-
73
-
74
-
75
-
76
-
77
-
78
-
79
-
80
-
81
-
82
-
83
-
84
-
85
-
86
-
87
-
88
-
89
-
90
-
91
-
92
-
93
-
94
-
95
-
96
-
97
-
98
-
99
-
100
-
101
-
102
-
103
-
104
-
105
-
106
-
107
-
108
-
109
-
110
-
111
-
112
-
113
-
114
-
115
-
116
-
117
-
118
-
119
-
120
-
121
-
122
-
123
-
124
-
125
-
126
-
127
-
128
-
129
-
130
-
131
-
132
-
133
-
134
-
135
-
136
-
137
-
138
-
139
-
140
-
141
-
142
-
143
-
144
-
145
-
146
-
147
-
148
-
149
-
150
-
151
-
152
-
153
-
154
-
155
-
156
-
157
-
158
-
159
-
160
-
161
-
162
-
163
-
164
-
165
-
166
-
167
-
168
-
169
-
170
-
171
-
172
-
173
-
174
-
175
-
176
-
177
-
178
-
179
-
180
-
181
-
182
-
183
-
184
-
185
-
186
-
187
-
188
-
189
-
190
 |
 |

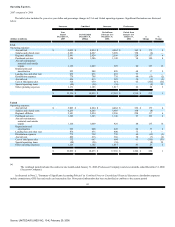
Predecessor
Successor
Combined
Predecessor
(Dollars in millions)
Period from
January 1 to
January 31,
2006
Period from
February 1 to
December 31,
2006
Period
Ended
December 31,
2006(a)
Year
Ended
December 31,
2005
$
Change
%
Change
United
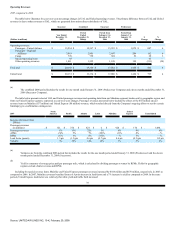
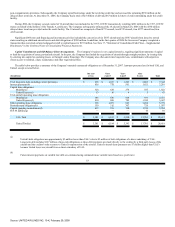
Aircraft fuel $ 362 $ 4,462 $ 4,824 $ 4,032 $ 792 20
Salaries and related costs 358 3,907 4,265 4,014 251 6
Regional affiliates 228 2,596 2,824 2,746 78 3
Purchased services 97 1,146 1,243 1,049 194 18
Aircraft maintenance materials
and outside repairs 80 929 1,009 881 128 15
Depreciation and amortization 68 820 888 854 34 4
Landing fees and other rent 75 800 875 915 (40) (4)
Distribution expenses 60 738 798 775 23 3
Cost of third party sales 63 604 667 656 11 2
Aircraft rent 30 386 416 404 12 3
Special operating items — (36) (36) 5 (41) —
Other operating expenses 85 1,017 1,102 1,198 (96) (8)
$ 1,506 $ 17,369 $ 18,875 $ 17,529 $ 1,346 8
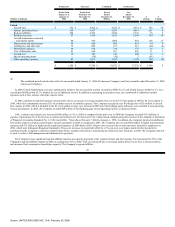
(a)
The combined period includes the results for one month ended January 31, 2006 (Predecessor Company) and eleven months ended December 31, 2006
(Successor Company).
In 2006, United implemented a resource optimization initiative that increased the number of mainline ASMs by 1% and United Express ASMs by 3%, for a
consolidated ASM growth of 2%, without the use of additional aircraft. In addition to generating increased revenue, this contributed to additional variable
expenses such as fuel, salaries, and other expense items.
In 2006, mainline aircraft fuel expense increased 20% due to an increase in average mainline fuel cost from $1.79 per gallon in 2005 to $2.11 per gallon in
2006, while fuel consumption increased 2% on a similar increase in mainline capacity. The Company recognized a net fuel hedge loss of $26 million in aircraft
fuel expense in 2006, which is included in the $2.11 per gallon average cost, whereas in 2005 most fuel hedging gains and losses were recorded in non-operating
income and expense. In 2005, the Company recorded $40 million of fuel hedging gains in non-operating income, as discussed below.
UAL 's salaries and related costs increased $240 million, or 6%, in 2006 as compared to the prior year. In 2006 the Company recorded $159 million of
expense, representing 4% of the increase in salaries and related costs, for Successor UAL 's share-based compensation plans because of the adoption of Statement
of Financial Accounting Standards No. 123 (Revised 2004), "Share-Based Payment," effective January 1, 2006. In addition, the Company incurred an additional
$26 million related to employee performance incentive programs in 2006 as compared to 2005. The Company also recorded $64 million in higher postretirement
expenses and $35 million in higher medical and dental expenses in 2006 than in 2005. Salaries also increased due to merit increases awarded to employees in
2006, which were infrequent throughout bankruptcy. These cost increases were partially offset by a 6% year-over-year improvement in labor productivity
resulting from the Company's continuous improvement efforts, together with selective outsourcing of certain non-core functions. In 2006, the Company achieved
its goal to reduce 1,000 management and administrative positions.
The Company's most significant regional affiliate expenses are capacity payments to the regional carriers and fuel expense. Fuel accounted for 30% of the
Company's regional affiliate expense in 2006, as compared to 26% in 2005. Fuel cost increased due to increased market prices for jet fuel, as discussed above,
and increased fuel consumption from higher capacity. The Company's regional affiliate
45
Source: UNITED AIR LINES INC, 10-K, February 29, 2008