United Airlines 2007 Annual Report Download - page 106
Download and view the complete annual report
Please find page 106 of the 2007 United Airlines annual report below. You can navigate through the pages in the report by either clicking on the pages listed below, or by using the keyword search tool below to find specific information within the annual report.-
 1
1 -
2
-
3
-
4
-
5
-
6
-
7
-
8
-
9
-
10
-
11
-
12
-
13
-
14
-
15
-
16
-
17
-
18
-
19
-
20
-
21
-
22
-
23
-
24
-
25
-
26
-
27
-
28
-
29
-
30
-
31
-
32
-
33
-
34
-
35
-
36
-
37
-
38
-
39
-
40
-
41
-
42
-
43
-
44
-
45
-
46
-
47
-
48
-
49
-
50
-
51
-
52
-
53
-
54
-
55
-
56
-
57
-
58
-
59
-
60
-
61
-
62
-
63
-
64
-
65
-
66
-
67
-
68
-
69
-
70
-
71
-
72
-
73
-
74
-
75
-
76
-
77
-
78
-
79
-
80
-
81
-
82
-
83
-
84
-
85
-
86
-
87
-
88
-
89
-
90
-
91
-
92
-
93
-
94
-
95
-
 96
96 -
 97
97 -
 98
98 -
 99
99 -
 100
100 -
 101
101 -
 102
102 -
 103
103 -
 104
104 -
 105
105 -
 106
106 -
 107
107 -
 108
108 -
 109
109 -
 110
110 -
 111
111 -
 112
112 -
 113
113 -
 114
114 -
 115
115 -
 116
116 -
117
-
118
-
119
-
120
-
121
-
122
-
123
-
124
-
125
-
126
-
127
-
128
-
129
-
130
-
131
-
132
-
133
-
134
-
135
-
136
-
137
-
138
-
139
-
140
-
141
-
142
-
143
-
144
-
145
-
146
-
147
-
148
-
149
-
150
-
151
-
152
-
153
-
154
-
155
-
156
-
157
-
158
-
159
-
160
-
161
-
162
-
163
-
164
-
165
-
166
-
167
-
168
-
169
-
170
-
171
-
172
-
173
-
174
-
175
-
176
-
177
-
178
-
179
-
180
-
181
-
182
-
183
-
184
-
185
-
186
-
187
-
188
-
189
-
190
 |
 |

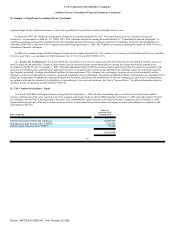
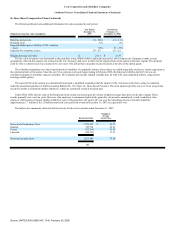
UAL Corporation and Subsidiary Companies
Combined Notes to Consolidated Financial Statements (Continued)
(4) UAL Per Share Amounts (Continued)
are not included in the diluted earnings per share calculation as it is UAL's intent to redeem these notes with cash. The table below represents the reconciliation
of the basic earnings per share to diluted earnings per share.
Successor
Predecessor
(In millions, except per share)
Year Ended
December 31,
2007
Period from
February 1 to
December 31,
2006
Period from
January 1 to
January 31,
2006
Year Ended
December 31,
2005
UAL
Basic earnings per share:
Net income (loss) $ 403 $ 25 $ 22,851 $ (21,176)
Preferred stock dividend requirements (10) (9) (1) (10)
Earnings (loss) available to common
stockholders $ 393 $ 16 $ 22,850 $ (21,186)
Basic weighted-average shares
outstanding 117.4 115.5 116.2 116.2
Earnings (loss) per share, basic $ 3.34 $ 0.14 $ 196.61 $ (182.29)
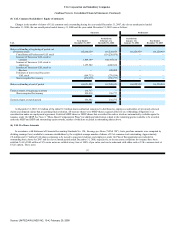
Diluted earnings per share:
Earnings (loss) available to common
stockholders $ 393 $ 16 $ 22,850 $ (21,186)
Effect of 2% preferred securities 10 — — —
Effect of 4.5% senior
limited-subordination convertible
notes 20 — — —
Effect of 5% convertible notes 5 — — —
Earnings available to common
stockholders including the effect of
dilutive securities $ 428 $ 16 $ 22,850 $ (21,186)
Basic weighted-average shares
outstanding 117.4 115.5 116.2 116.2
Effect of non-vested stock options 0.2 — — —
Effect of non-vested restricted shares 1.1 0.7 — —
Effect of 2% preferred securities 11.0 — — —
Effect of 4.5% senior
limited-subordination convertible
notes 20.8 — — —
Effect of 5% convertible notes 3.2 — — —
Diluted weighted-average shares
outstanding 153.7 116.2 116.2 116.2
Earnings (loss) per share, diluted $ 2.79 $ 0.14 $ 196.61 $ (182.29)
Potentially dilutive shares excluded from
diluted per share amounts:
Stock options 4.0 5.0 9.0 9.0
Restricted shares 0.9 2.0 — —
2% preferred securities — 10.8 — —
4.5% senior limited-subordination
convertible notes — 20.8 — —
5% convertible notes — 3.2 — —
4.9 41.8 9.0 9.0
(5) Share-Based Compensation Plans
Source: UNITED AIR LINES INC, 10-K, February 29, 2008