United Airlines 2007 Annual Report Download - page 144
Download and view the complete annual report
Please find page 144 of the 2007 United Airlines annual report below. You can navigate through the pages in the report by either clicking on the pages listed below, or by using the keyword search tool below to find specific information within the annual report.-
 1
1 -
2
-
3
-
4
-
5
-
6
-
7
-
8
-
9
-
10
-
11
-
12
-
13
-
14
-
15
-
16
-
17
-
18
-
19
-
20
-
21
-
22
-
23
-
24
-
25
-
26
-
27
-
28
-
29
-
30
-
31
-
32
-
33
-
34
-
35
-
36
-
37
-
38
-
39
-
40
-
41
-
42
-
43
-
44
-
45
-
46
-
47
-
48
-
49
-
50
-
51
-
52
-
53
-
54
-
55
-
56
-
57
-
58
-
59
-
60
-
61
-
62
-
63
-
64
-
65
-
66
-
67
-
68
-
69
-
70
-
71
-
72
-
73
-
74
-
75
-
76
-
77
-
78
-
79
-
80
-
81
-
82
-
83
-
84
-
85
-
86
-
87
-
88
-
89
-
90
-
91
-
92
-
93
-
94
-
95
-
96
-
97
-
98
-
99
-
100
-
101
-
102
-
103
-
104
-
105
-
106
-
107
-
108
-
109
-
110
-
111
-
112
-
113
-
114
-
115
-
116
-
117
-
118
-
119
-
120
-
121
-
122
-
123
-
124
-
125
-
126
-
127
-
128
-
129
-
130
-
131
-
132
-
133
-
 134
134 -
 135
135 -
 136
136 -
 137
137 -
 138
138 -
 139
139 -
 140
140 -
 141
141 -
 142
142 -
 143
143 -
 144
144 -
 145
145 -
 146
146 -
 147
147 -
 148
148 -
 149
149 -
 150
150 -
 151
151 -
 152
152 -
 153
153 -
 154
154 -
155
-
156
-
157
-
158
-
159
-
160
-
161
-
162
-
163
-
164
-
165
-
166
-
167
-
168
-
169
-
170
-
171
-
172
-
173
-
174
-
175
-
176
-
177
-
178
-
179
-
180
-
181
-
182
-
183
-
184
-
185
-
186
-
187
-
188
-
189
-
190
 |
 |

UAL Corporation and Subsidiary Companies
Combined Notes to Consolidated Financial Statements (Continued)
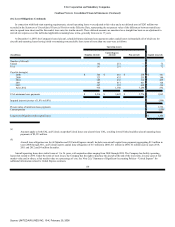
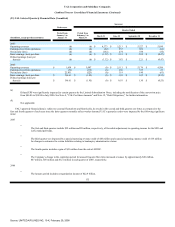
(23) UAL Selected Quarterly Financial Data (Unaudited)
Successor
Predecessor
Quarter Ended
(In millions, except per share amounts)
Period from
January 1 to
January 31
Period from
February 1 to
March 31
March 31
June 30
September 30
December 31
2007:
Operating revenues (b) (b) $ 4,373 $ 5,213 $ 5,527 $ 5,030
Earnings (loss) from operations (b) (b) (92) 537 656 (64)
Net income (loss) (b) (b) (152) 274 334 (53)
Basic earnings (loss) per share (b) (b) $ (1.32) $ 2.31 $ 2.82 $ (0.47)
Diluted earnings (loss) per
share(a) (b) (b) $ (1.32) $ 1.83 $ 2.21 $ (0.47)
2006:
Operating revenues $ 1,458 $ 3,007 (b) $ 5,113 $ 5,176 $ 4,586
Earnings (loss) from operations (52) (119) (b) 260 335 23
Net income (loss) 22,851 (223) (b) 119 190 (61)
Basic earnings (loss) per share $ 196.61 $ (1.95) (b) $ 1.01 $ 1.62 $ (0.55)
Diluted earnings (loss) per
share(a) $ 196.61 $ (1.95) (b) $ 0.93 $ 1.30 $ (0.55)
(a)
Diluted EPS was significantly impacted in certain quarters by the Limited-Subordination Notes, including the modification of the conversion price
from $46.86 to $34.84 in July 2006. See Note 4, "UAL Per Share Amounts" and Note 12, "Debt Obligations," for further information.
(b)
Not applicable.
UAL's quarterly financial data is subject to seasonal fluctuations and historically, its results in the second and third quarters are better as compared to the
first and fourth quarters of each year since the latter quarters normally reflect weaker demand. UAL's quarterly results were impacted by the following significant
items:
2007
•
The first and third quarters include $22 million and $8 million, respectively, of favorable adjustments to operating income for the SFO and
LAX municipal bonds.
•
The third quarter was impacted by a special operating revenue credit of $45 million and a special operating expense credit of $14 million
for changes in estimates for certain liabilities relating to bankruptcy administrative claims.
•
The fourth quarter includes a gain of $41 million from the sale of ARINC.
•
The Company's change in the expiration period for unused frequent flier miles increased revenues by approximately $28 million,
$47 million, $50 million and $121 million in each quarter of 2007, respectively.
2006
•
The January period includes reorganization income of $22.9 billion.
135
Source: UNITED AIR LINES INC, 10-K, February 29, 2008