United Airlines 2007 Annual Report Download - page 40
Download and view the complete annual report
Please find page 40 of the 2007 United Airlines annual report below. You can navigate through the pages in the report by either clicking on the pages listed below, or by using the keyword search tool below to find specific information within the annual report.-
 1
1 -
2
-
3
-
4
-
5
-
6
-
7
-
8
-
9
-
10
-
11
-
12
-
13
-
14
-
15
-
16
-
17
-
18
-
19
-
20
-
21
-
22
-
23
-
24
-
25
-
26
-
27
-
28
-
29
-
 30
30 -
 31
31 -
 32
32 -
 33
33 -
 34
34 -
 35
35 -
 36
36 -
 37
37 -
 38
38 -
 39
39 -
 40
40 -
 41
41 -
 42
42 -
 43
43 -
 44
44 -
 45
45 -
 46
46 -
 47
47 -
 48
48 -
 49
49 -
 50
50 -
51
-
52
-
53
-
54
-
55
-
56
-
57
-
58
-
59
-
60
-
61
-
62
-
63
-
64
-
65
-
66
-
67
-
68
-
69
-
70
-
71
-
72
-
73
-
74
-
75
-
76
-
77
-
78
-
79
-
80
-
81
-
82
-
83
-
84
-
85
-
86
-
87
-
88
-
89
-
90
-
91
-
92
-
93
-
94
-
95
-
96
-
97
-
98
-
99
-
100
-
101
-
102
-
103
-
104
-
105
-
106
-
107
-
108
-
109
-
110
-
111
-
112
-
113
-
114
-
115
-
116
-
117
-
118
-
119
-
120
-
121
-
122
-
123
-
124
-
125
-
126
-
127
-
128
-
129
-
130
-
131
-
132
-
133
-
134
-
135
-
136
-
137
-
138
-
139
-
140
-
141
-
142
-
143
-
144
-
145
-
146
-
147
-
148
-
149
-
150
-
151
-
152
-
153
-
154
-
155
-
156
-
157
-
158
-
159
-
160
-
161
-
162
-
163
-
164
-
165
-
166
-
167
-
168
-
169
-
170
-
171
-
172
-
173
-
174
-
175
-
176
-
177
-
178
-
179
-
180
-
181
-
182
-
183
-
184
-
185
-
186
-
187
-
188
-
189
-
190
 |
 |

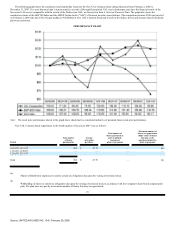
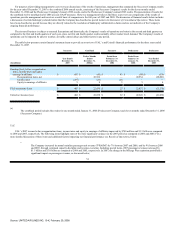
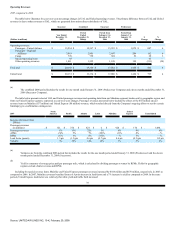
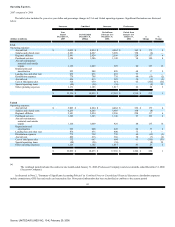
Operating Revenues.
2007 compared to 2006
The table below illustrates the year-over-year percentage changes in UAL and United operating revenues. The primary difference between UAL and United
revenues is due to other revenues at UAL, which are generated from minor direct subsidiaries of UAL.
Successor
Combined
Successor
Predecessor
(Dollars in millions)
Year Ended
December 31,
2007
Period
Ended
December 31,
2006(a)
Period from
February 1 to
December 31,
2006
Period from
January 1 to
January 31,
2006
$
Change
%
Change
Operating revenues:
Passenger—United Airlines $ 15,254 $ 14,367 $ 13,293 $ 1,074 $ 887 6
Passenger—Regional
Affiliates 3,063 2,901 2,697 204 162 6
Cargo 770 750 694 56 20 3
Special operating items 45 — — — 45 —
Other operating revenues 1,011 1,322 1,198 124 (311) (24)
UAL total $ 20,143 $ 19,340 $ 17,882 $ 1,458 $ 803 4
United total $ 20,131 $ 19,334 $ 17,880 $ 1,454 $ 797 4
(a)
The combined 2006 period includes the results for one month ended January 31, 2006 (Predecessor Company) and eleven months ended December 31,
2006 (Successor Company).
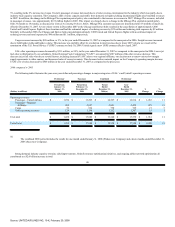
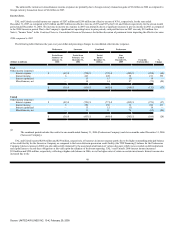
The table below presents selected UAL and United passenger revenues and operating data from our Mainline segment, broken out by geographic region, and
from our United Express segment, expressed as year-over-year changes. Passenger revenues presented below include the effects of the $45 million special
revenue items on Mainline ($37 million) and United Express ($8 million) revenue, which resulted directly from the Company's ongoing efforts to resolve certain
bankruptcy pre-confirmation contingencies.
2007
North
America
Pacific
Atlantic
Latin
Mainline
United
Express
Consolidated
Increase (decrease) from
2006(a):
Passenger revenues
(in millions) $ 121 $ 374 $ 423 $ 6 $ 924 $ 170 $ 1,094
Passenger revenues 1% 13% 22% 1% 6% 6% 6%
ASMs (3)% 3% 7% (10)% (1)% 4% —%
RPMs (1)% 1% 8% (11)% —% 3% —%
Load factor (points) 1.5 pts (1.5) pts 0.6 pts (0.7) pts 0.6 pts (0.3) pts 0.5 pts
Yield(b) 3% 12% 14% 14% 7% 3% 6%
(a)
Variances are from the combined 2006 period that includes the results for the one month period ended January 31, 2006 (Predecessor) and the eleven
month period ended December 31, 2006 (Successor).
(b)
Yield is a measure of average price paid per passenger mile, which is calculated by dividing passenger revenues by RPMs. Yields for geographic
regions exclude charter revenue and RPMs.
Including the special revenue items, Mainline and United Express passenger revenues increased by $924 million and $170 million, respectively, in 2007 as
compared to 2006. In 2007, Mainline revenues benefited from a 0.6 point increase in load factor and a 7% increase in yield as compared to 2006. In the same
periods, United Express load factor was relatively flat while yield and traffic both increased
39
Source: UNITED AIR LINES INC, 10-K, February 29, 2008