United Airlines 2007 Annual Report Download - page 42
Download and view the complete annual report
Please find page 42 of the 2007 United Airlines annual report below. You can navigate through the pages in the report by either clicking on the pages listed below, or by using the keyword search tool below to find specific information within the annual report.-
 1
1 -
2
-
3
-
4
-
5
-
6
-
7
-
8
-
9
-
10
-
11
-
12
-
13
-
14
-
15
-
16
-
17
-
18
-
19
-
20
-
21
-
22
-
23
-
24
-
25
-
26
-
27
-
28
-
29
-
30
-
31
-
 32
32 -
 33
33 -
 34
34 -
 35
35 -
 36
36 -
 37
37 -
 38
38 -
 39
39 -
 40
40 -
 41
41 -
 42
42 -
 43
43 -
 44
44 -
 45
45 -
 46
46 -
 47
47 -
 48
48 -
 49
49 -
 50
50 -
 51
51 -
 52
52 -
53
-
54
-
55
-
56
-
57
-
58
-
59
-
60
-
61
-
62
-
63
-
64
-
65
-
66
-
67
-
68
-
69
-
70
-
71
-
72
-
73
-
74
-
75
-
76
-
77
-
78
-
79
-
80
-
81
-
82
-
83
-
84
-
85
-
86
-
87
-
88
-
89
-
90
-
91
-
92
-
93
-
94
-
95
-
96
-
97
-
98
-
99
-
100
-
101
-
102
-
103
-
104
-
105
-
106
-
107
-
108
-
109
-
110
-
111
-
112
-
113
-
114
-
115
-
116
-
117
-
118
-
119
-
120
-
121
-
122
-
123
-
124
-
125
-
126
-
127
-
128
-
129
-
130
-
131
-
132
-
133
-
134
-
135
-
136
-
137
-
138
-
139
-
140
-
141
-
142
-
143
-
144
-
145
-
146
-
147
-
148
-
149
-
150
-
151
-
152
-
153
-
154
-
155
-
156
-
157
-
158
-
159
-
160
-
161
-
162
-
163
-
164
-
165
-
166
-
167
-
168
-
169
-
170
-
171
-
172
-
173
-
174
-
175
-
176
-
177
-
178
-
179
-
180
-
181
-
182
-
183
-
184
-
185
-
186
-
187
-
188
-
189
-
190
 |
 |

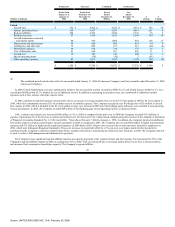
operating revenue to $19.3 billion in 2006. The 11% mainline passenger revenue increase was due to both increased traffic and higher average ticket prices;
United reported a 3% increase in mainline traffic on a 2% increase in capacity and an 8% increase in yield. Severe winter storms in December 2006 at the
Chicago and Denver hubs, which resulted in the cancellation of approximately 3,900 United and United Express flights at these locations, had the estimated
impact of reducing revenue by $40 million and reducing total expenses by $11 million. As discussed in "Critical Accounting Policies," below, the Company
changed the accounting for its frequent flyer obligation to a deferred revenue model upon its emergence from bankruptcy which negatively impacted revenues by
$158 million. This resulted in increased deferred revenue due to a net increase in miles earned by Mileage Plus customers that will be redeemed in future years.
In 2005, UAL 's other revenues were $75 million more than United's other revenues primarily due to revenues generated by UAL 's direct subsidiary
MyPoints, which was sold by UAL in 2006.
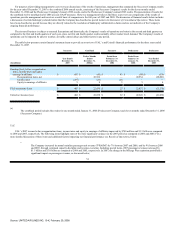
The 19% increase in regional affiliate revenues was also due to traffic and yield improvements as indicated in the table below.
The increase in cargo revenue was primarily due to improved yield, which was partially due to higher fuel surcharges between periods.
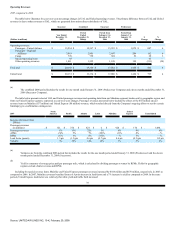
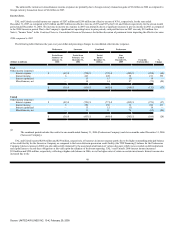
The table below presents selected passenger revenues and operating data by geographic region and the Company's mainline and United Express segments
expressed as period-to-period changes:
2006
North
America
Pacific
Atlantic
Latin
Mainline
United
Express
Consolidated
Increase (decrease) from
2005(a):
Passenger revenues
(in millions) $ 1,022 $ 234 $ 118 $ 79 $ 1,453 $ 472 $ 1,925
Passenger revenues 13% 9% 6 % 19% 11% 19% 13%
ASMs 4% —% (2)% 9% 2% 9% 3%
RPMs 4% 1% (2)% 13% 3% 13% 4%
Load factor (points) 0.3 pts 1.4 pts 0.7 pts 2.6 pts 0.7 pts 2.7 pts 0.8 pts
Yield(b) 9% 8% 9 % 6% 8% 6% 9%
(a)
The combined 2006 period includes the results for one month ended January 31, 2006 (Predecessor Company) and eleven months ended December 31,
2006 (Successor Company).
(b)
Yields for geographic regions exclude charter revenue and revenue passenger miles.
41
Source: UNITED AIR LINES INC, 10-K, February 29, 2008