United Airlines 2007 Annual Report Download - page 125
Download and view the complete annual report
Please find page 125 of the 2007 United Airlines annual report below. You can navigate through the pages in the report by either clicking on the pages listed below, or by using the keyword search tool below to find specific information within the annual report.-
 1
1 -
2
-
3
-
4
-
5
-
6
-
7
-
8
-
9
-
10
-
11
-
12
-
13
-
14
-
15
-
16
-
17
-
18
-
19
-
20
-
21
-
22
-
23
-
24
-
25
-
26
-
27
-
28
-
29
-
30
-
31
-
32
-
33
-
34
-
35
-
36
-
37
-
38
-
39
-
40
-
41
-
42
-
43
-
44
-
45
-
46
-
47
-
48
-
49
-
50
-
51
-
52
-
53
-
54
-
55
-
56
-
57
-
58
-
59
-
60
-
61
-
62
-
63
-
64
-
65
-
66
-
67
-
68
-
69
-
70
-
71
-
72
-
73
-
74
-
75
-
76
-
77
-
78
-
79
-
80
-
81
-
82
-
83
-
84
-
85
-
86
-
87
-
88
-
89
-
90
-
91
-
92
-
93
-
94
-
95
-
96
-
97
-
98
-
99
-
100
-
101
-
102
-
103
-
104
-
105
-
106
-
107
-
108
-
109
-
110
-
111
-
112
-
113
-
114
-
 115
115 -
 116
116 -
 117
117 -
 118
118 -
 119
119 -
 120
120 -
 121
121 -
 122
122 -
 123
123 -
 124
124 -
 125
125 -
 126
126 -
 127
127 -
 128
128 -
 129
129 -
 130
130 -
 131
131 -
 132
132 -
 133
133 -
 134
134 -
 135
135 -
136
-
137
-
138
-
139
-
140
-
141
-
142
-
143
-
144
-
145
-
146
-
147
-
148
-
149
-
150
-
151
-
152
-
153
-
154
-
155
-
156
-
157
-
158
-
159
-
160
-
161
-
162
-
163
-
164
-
165
-
166
-
167
-
168
-
169
-
170
-
171
-
172
-
173
-
174
-
175
-
176
-
177
-
178
-
179
-
180
-
181
-
182
-
183
-
184
-
185
-
186
-
187
-
188
-
189
-
190
 |
 |
UAL Corporation and Subsidiary Companies
Combined Notes to Consolidated Financial Statements (Continued)
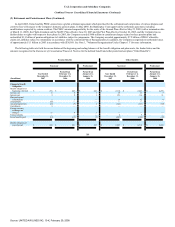
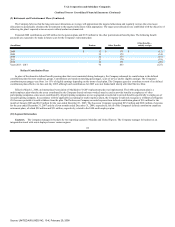
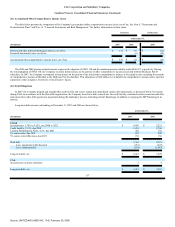
(10) Segment Information (Continued)
were so assigned. As a result of this process, all of the Company's goodwill has been allocated to the Mainline segment. See Note 8, "Intangibles," for further
information related to goodwill.
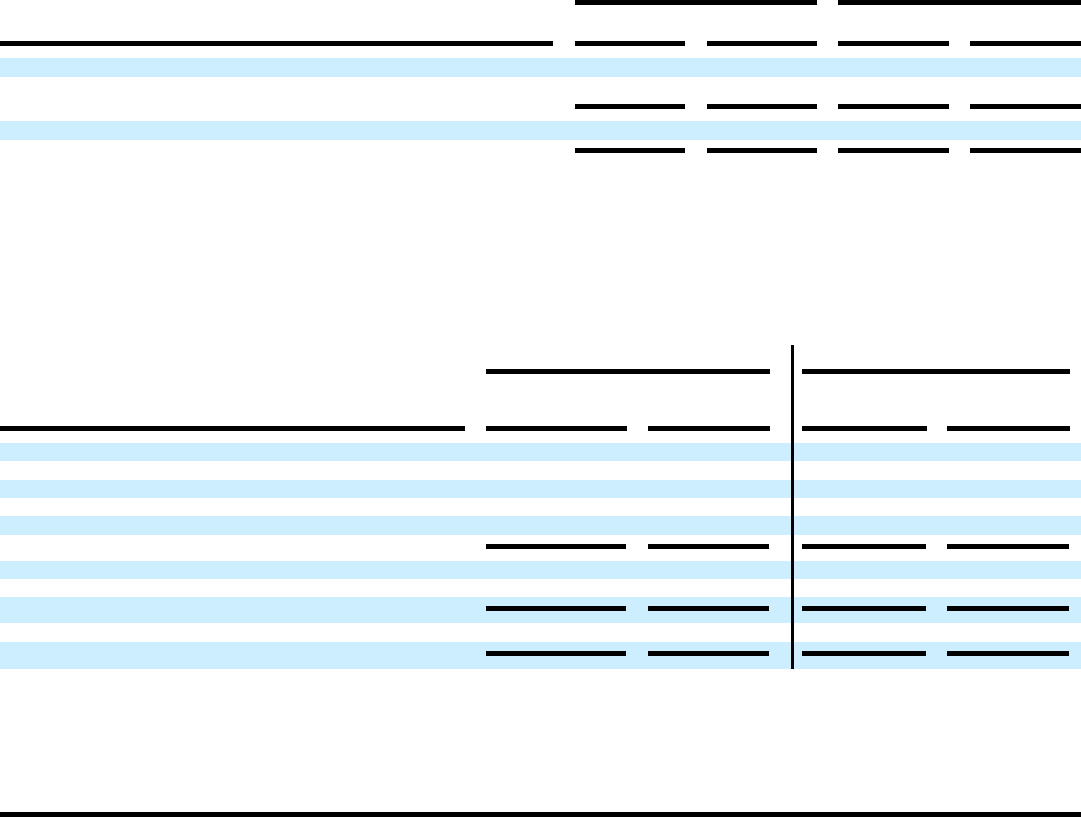
At December 31, 2007 and 2006, UAL's and United's net carrying values of Mainline and United Express segment assets were as follows:
UAL
United
(In millions)
2007
2006
2007
2006
Mainline segment $ 24,149 $ 25,294 $ 24,165 $ 25,506
United Express segment 71 75 71 75
Total assets $ 24,220 $ 25,369 $ 24,236 $ 25,581
United Express assets include only those assets directly associated with its operations. The Company does not allocate corporate assets to the United
Express segment. The Company's capital expenditures are reported in the Company's Consolidated Statements of Cash Flows and are related to its Mainline
operations.
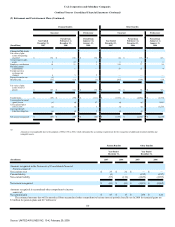
UAL and United's operating revenue by principal geographic region (as defined by the U.S. Department of Transportation) for the year ended December 31,
2007, the eleven month period ended December 31, 2006, the one month period ended January 31, 2006 and the year ended December 31, 2005 is presented in
the table below.
Successor
Predecessor
(In millions)
Year Ended
December 31, 2007
February 1 to
December 31, 2006
January 1 to
January 31, 2006
Year Ended
December 31, 2005
UAL
Domestic (U.S. and Canada) $ 14,006 $ 11,981 $ 953 $ 11,411
Pacific 3,262 3,214 283 3,283
Atlantic 2,365 2,158 167 2,189
Latin America 510 529 55 496
Total UAL $ 20,143 $ 17,882 $ 1,458 $ 17,379
Less: UAL other domestic (12) (2) (4) (75)
Total United $ 20,131 $ 17,880 $ 1,454 $ 17,304
The Company attributes revenue among the geographic areas based upon the origin and destination of each flight segment. United's operations involve an
insignificant level of dedicated revenue-producing assets in geographic regions as the overwhelming majority of the Company's revenue producing assets
(primarily U.S. registered aircraft) generally can be deployed in any of its geographic regions, as any given aircraft may be used in multiple geographic regions
on any given day.
116
Source: UNITED AIR LINES INC, 10-K, February 29, 2008