United Airlines 2007 Annual Report Download - page 49
Download and view the complete annual report
Please find page 49 of the 2007 United Airlines annual report below. You can navigate through the pages in the report by either clicking on the pages listed below, or by using the keyword search tool below to find specific information within the annual report.-
 1
1 -
2
-
3
-
4
-
5
-
6
-
7
-
8
-
9
-
10
-
11
-
12
-
13
-
14
-
15
-
16
-
17
-
18
-
19
-
20
-
21
-
22
-
23
-
24
-
25
-
26
-
27
-
28
-
29
-
30
-
31
-
32
-
33
-
34
-
35
-
36
-
37
-
38
-
 39
39 -
 40
40 -
 41
41 -
 42
42 -
 43
43 -
 44
44 -
 45
45 -
 46
46 -
 47
47 -
 48
48 -
 49
49 -
 50
50 -
 51
51 -
 52
52 -
 53
53 -
 54
54 -
 55
55 -
 56
56 -
 57
57 -
 58
58 -
 59
59 -
60
-
61
-
62
-
63
-
64
-
65
-
66
-
67
-
68
-
69
-
70
-
71
-
72
-
73
-
74
-
75
-
76
-
77
-
78
-
79
-
80
-
81
-
82
-
83
-
84
-
85
-
86
-
87
-
88
-
89
-
90
-
91
-
92
-
93
-
94
-
95
-
96
-
97
-
98
-
99
-
100
-
101
-
102
-
103
-
104
-
105
-
106
-
107
-
108
-
109
-
110
-
111
-
112
-
113
-
114
-
115
-
116
-
117
-
118
-
119
-
120
-
121
-
122
-
123
-
124
-
125
-
126
-
127
-
128
-
129
-
130
-
131
-
132
-
133
-
134
-
135
-
136
-
137
-
138
-
139
-
140
-
141
-
142
-
143
-
144
-
145
-
146
-
147
-
148
-
149
-
150
-
151
-
152
-
153
-
154
-
155
-
156
-
157
-
158
-
159
-
160
-
161
-
162
-
163
-
164
-
165
-
166
-
167
-
168
-
169
-
170
-
171
-
172
-
173
-
174
-
175
-
176
-
177
-
178
-
179
-
180
-
181
-
182
-
183
-
184
-
185
-
186
-
187
-
188
-
189
-
190
 |
 |

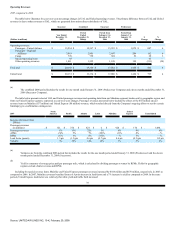
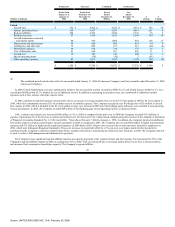
The unfavorable variances in miscellaneous income (expense) are primarily due to foreign currency transaction gains of $9 million in 2006 as compared to
foreign currency transaction losses of $4 million in 2007.
Income Taxes.
UAL and United recorded income tax expense of $297 million and $296 million (an effective tax rate of 43%), respectively, for the year ended
December 31, 2007, as compared to $21 million and $29 million (an effective tax rate of 49% and 50%) for UAL and United, respectively, for the eleven month
period ended December 31, 2006. The increase in income tax expense in 2007 was primarily due to a significant increase in pre-tax income in 2007 as compared
to the 2006 Successor period. Due to the Company's significant net operating losses in prior periods, cash paid for taxes in 2007 was only $10 million. See
Note 6, "Income Taxes" in the Combined Notes to Consolidated Financial Statements for further discussion of permanent items impacting the effective tax rates.
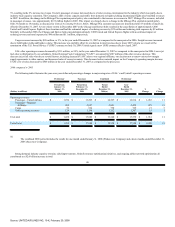
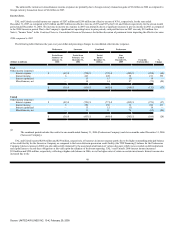
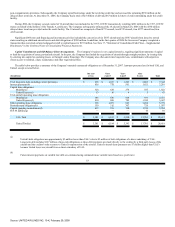
2006 compared to 2005
The following table illustrates the year-over-year dollar and percentage changes in consolidated other income (expense).
Predecessor
Successor
Combined
Predecessor
(Dollars in millions)
Period from
January 1 to
January 31,
2006
Period from
February 1 to
December 31,
2006
Period
Ended
December 31,
2006(a)
Year
Ended
December 31,
2005
Favorable
(Unfavorable)
%
Change
UAL
Other income (expense):
Interest expense $ (42) $ (728) $ (770) $ (482) $ (288) (60)
Interest income 6 243 249 38 211 555
Interest capitalized — 15 15 (3) 18 —
Miscellaneous, net — 14 14 87 (73) (84)
$ (36) $ (456) $ (492) $ (360) $ (132) (37)
United
Other income (expense):
Interest expense $ (42) $ (729) $ (771) $ (492) $ (279) (57)
Interest income 6 250 256 36 220 611
Interest capitalized — 15 15 (3) 18 —
Miscellaneous, net — 11 11 76 (65) (86)
$ (36) $ (453) $ (489) $ (383) $ (106) (28)
(a)
The combined period includes the results for one month ended January 31, 2006 (Predecessor Company) and eleven months ended December 31, 2006
(Successor Company).
UAL and United incurred $288 million and $279 million, respectively, of increases in interest expense partly due to the higher outstanding principal balance
of the credit facility for the Successor Company, as compared to the lower debtor-in-possession credit facility (the "DIP Financing") balance for the Predecessor
Company. Interest expense in 2006 was also unfavorably impacted by the associated amortization of various discounts which were recorded on debt instruments
and capital leases to record these obligations at fair value upon the adoption of fresh-start reporting. UAL 's and United's 2006 interest income increased
$211million and $220 million, respectively, reflecting a higher cash balance in 2006, as well as higher rates of return on certain investments. Interest income also
increased due to the
48
Source: UNITED AIR LINES INC, 10-K, February 29, 2008