Travelers 2006 Annual Report Download - page 98
Download and view the complete annual report
Please find page 98 of the 2006 Travelers annual report below. You can navigate through the pages in the report by either clicking on the pages listed below, or by using the keyword search tool below to find specific information within the annual report.-
 1
1 -
2
-
3
-
4
-
5
-
6
-
7
-
8
-
9
-
10
-
11
-
12
-
13
-
14
-
15
-
16
-
17
-
18
-
19
-
20
-
21
-
22
-
23
-
24
-
25
-
26
-
27
-
28
-
29
-
30
-
31
-
32
-
33
-
34
-
35
-
36
-
37
-
38
-
39
-
40
-
41
-
42
-
43
-
44
-
45
-
46
-
47
-
48
-
49
-
50
-
51
-
52
-
53
-
54
-
55
-
56
-
57
-
58
-
59
-
60
-
61
-
62
-
63
-
64
-
65
-
66
-
67
-
68
-
69
-
70
-
71
-
72
-
73
-
74
-
75
-
76
-
77
-
78
-
79
-
80
-
81
-
82
-
83
-
84
-
85
-
86
-
87
-
 88
88 -
 89
89 -
 90
90 -
 91
91 -
 92
92 -
 93
93 -
 94
94 -
 95
95 -
 96
96 -
 97
97 -
 98
98 -
 99
99 -
 100
100 -
 101
101 -
 102
102 -
 103
103 -
 104
104 -
 105
105 -
 106
106 -
 107
107 -
 108
108 -
109
-
110
-
111
-
112
-
113
-
114
-
115
-
116
-
117
-
118
-
119
-
120
-
121
-
122
-
123
-
124
-
125
-
126
-
127
-
128
-
129
-
130
-
131
-
132
-
133
-
134
-
135
-
136
-
137
-
138
-
139
-
140
-
141
-
142
-
143
-
144
-
145
-
146
-
147
-
148
-
149
-
150
-
151
-
152
-
153
-
154
-
155
-
156
-
157
-
158
-
159
-
160
-
161
-
162
-
163
-
164
-
165
-
166
-
167
-
168
-
169
-
170
-
171
-
172
-
173
-
174
-
175
-
176
-
177
-
178
-
179
-
180
-
181
-
182
-
183
-
184
-
185
-
186
-
187
-
188
-
189
-
190
-
191
-
192
-
193
-
194
-
195
-
196
-
197
-
198
-
199
-
200
-
201
-
202
-
203
-
204
-
205
-
206
-
207
-
208
-
209
-
210
-
211
-
212
-
213
-
214
-
215
-
216
-
217
-
218
-
219
-
220
-
221
-
222
-
223
-
224
-
225
-
226
-
227
-
228
-
229
-
230
-
231
-
232
-
233
-
234
-
235
-
236
-
237
-
238
-
239
-
240
-
241
-
242
-
243
-
244
-
245
-
246
-
247
-
248
-
249
-
250
-
251
-
252
-
253
-
254
-
255
-
256
-
257
-
258
-
259
-
260
-
261
-
262
-
263
-
264
-
265
-
266
-
267
-
268
-
269
-
270
-
271
-
272
-
273
-
274
-
275
-
276
-
277
-
278
-
279
-
280
-
281
-
282
-
283
-
284
-
285
 |
 |
86
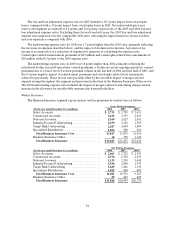
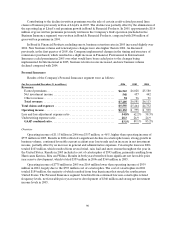
Commercial Accounts. Net written premiums of $2.38 billion in 2006 increased 2% over 2005, driven
by a strong increase in business retention rates and an improvement in renewal pricing. In 2005, net written
premiums of $2.33 billion grew $57 million, or 3%, over 2004 volume of $2.27 billion, reflecting the impact
of the merger. However, 2005 net written premiums declined from 2004 on a pro forma combined basis,
although business retention rates in this market in 2005 increased over 2004. New business volume also
grew over 2004. Renewal price changes in 2005 in Commercial Accounts declinedfrom 2004 and were in
the low single digits for the year, reflecting the increased competitive marketconditions.
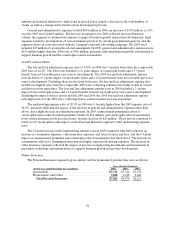
National Accounts. Net written premiums in 2006 declined by $95 million, or 8%, from 2005,
primarily reflecting a reduction in premiums related to favorable loss experience on business priced on a
loss-sensitive basis and lower new business volume, partially offset by the decline in ceded premiums at
Discover Re due to a change in the structure of reinsurance coverage. In2005, net written premiums grew
$190 million, or 18%, over 2004, reflecting the impact of the merger and changes in Discover Re’s
reinsurance program.
Industry-Focused Underwriting. Net written premiums of $2.20 billion increased by 6% over 2005,
driven by growth in the Construction and Oil & Gas business units. Favorable economic conditions in
these industry sectors, significant increases in business retention rates and continued strong new business
volume contributed to the increase in premium volume in 2006 in these two business units. The remaining
three business units in this market—Technology, Agribusiness and Public Sector—all achieved lesser
degrees ofnet written premium growth over 2005. Net written premium volume of $2.08 billion in 2005
increased 19% over the 2004 total of $1.75 billion,primarily reflecting the impact of the merger. On a pro
forma combined basis, Construction’s net written premiums in 2005 declined from 2004, reflecting lower
business volumes related to the process of aligning the underwriting profile of thetwo predecessor
companies during the latter half of 2004 and the first half of 2005. Oil & Gas net written premiums in 2005
grew significantly over 2004, primarily due to the impact of the merger, strong business retention rates and
higher new business volume.
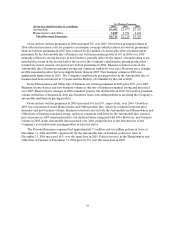
Target Risk Underwriting. Net written premiums of $1.63 billion in 2006 increased by 10% over 2005,
driven by strong growth in the National Property and Inland Marine business units. Significant renewal
price increases, particularly for Southeastern U.S. catastrophe-prone exposures, and strong business
retention rates were the primary factors accounting for net written premium growth in these two business
units in 2006. The Ocean Marine business unit also contributed to net written premium growth in 2006,
primarily due to a decrease in the amount of business ceded. In 2005, net written premiums of $1.48 billion
were 10% higher than 2004 net written premium volume of $1.35 billion, driven by the impact of the
merger. On a pro forma combined basis, however, net written premium volume in 2005 declined from
2004, primarily due to competitive market conditions for property and inland marine coverages. Ocean
Marine premium volume grew significantly in 2005, driven by renewal rights transactions.
Specialized Distribution.Net written premium volume in 2006 of $1.02 billion increased 13% over
2005, primarily driven by the transfer of certain national small business insurance programs from Select
Accounts to the National Programs business unit. In addition, Northland also experiencedpremium
growth in 2006, primarily resulting from higher business retention rates and new business volume in
commercial trucking, its primary line of business. In 2005, net written premium volume of $908 million
grew $101 million, or 13%,over 2004 net written premiums of $807 million. The growth in 2005 was
concentrated in National Programs and primarily reflected the impact of the merger and the transfer of
certain program business from Commercial Accounts. On a pro forma combined basis, net written
premiums in 2005 were level with 2004.
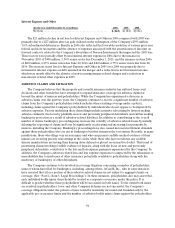
In Business Insurance Other, the 90% and 59% declines in2006 and 2005 net premium volume,
respectively, compared with the respective prior years reflected the impact of business in runoff and the
sale of the Company’s Personal Catastrophe Risk operation in November 2005. Therunoff healthcare,