Travelers 2006 Annual Report Download - page 168
Download and view the complete annual report
Please find page 168 of the 2006 Travelers annual report below. You can navigate through the pages in the report by either clicking on the pages listed below, or by using the keyword search tool below to find specific information within the annual report.-
 1
1 -
2
-
3
-
4
-
5
-
6
-
7
-
8
-
9
-
10
-
11
-
12
-
13
-
14
-
15
-
16
-
17
-
18
-
19
-
20
-
21
-
22
-
23
-
24
-
25
-
26
-
27
-
28
-
29
-
30
-
31
-
32
-
33
-
34
-
35
-
36
-
37
-
38
-
39
-
40
-
41
-
42
-
43
-
44
-
45
-
46
-
47
-
48
-
49
-
50
-
51
-
52
-
53
-
54
-
55
-
56
-
57
-
58
-
59
-
60
-
61
-
62
-
63
-
64
-
65
-
66
-
67
-
68
-
69
-
70
-
71
-
72
-
73
-
74
-
75
-
76
-
77
-
78
-
79
-
80
-
81
-
82
-
83
-
84
-
85
-
86
-
87
-
88
-
89
-
90
-
91
-
92
-
93
-
94
-
95
-
96
-
97
-
98
-
99
-
100
-
101
-
102
-
103
-
104
-
105
-
106
-
107
-
108
-
109
-
110
-
111
-
112
-
113
-
114
-
115
-
116
-
117
-
118
-
119
-
120
-
121
-
122
-
123
-
124
-
125
-
126
-
127
-
128
-
129
-
130
-
131
-
132
-
133
-
134
-
135
-
136
-
137
-
138
-
139
-
140
-
141
-
142
-
143
-
144
-
145
-
146
-
147
-
148
-
149
-
150
-
151
-
152
-
153
-
154
-
155
-
156
-
157
-
 158
158 -
 159
159 -
 160
160 -
 161
161 -
 162
162 -
 163
163 -
 164
164 -
 165
165 -
 166
166 -
 167
167 -
 168
168 -
 169
169 -
 170
170 -
 171
171 -
 172
172 -
 173
173 -
 174
174 -
 175
175 -
 176
176 -
 177
177 -
 178
178 -
179
-
180
-
181
-
182
-
183
-
184
-
185
-
186
-
187
-
188
-
189
-
190
-
191
-
192
-
193
-
194
-
195
-
196
-
197
-
198
-
199
-
200
-
201
-
202
-
203
-
204
-
205
-
206
-
207
-
208
-
209
-
210
-
211
-
212
-
213
-
214
-
215
-
216
-
217
-
218
-
219
-
220
-
221
-
222
-
223
-
224
-
225
-
226
-
227
-
228
-
229
-
230
-
231
-
232
-
233
-
234
-
235
-
236
-
237
-
238
-
239
-
240
-
241
-
242
-
243
-
244
-
245
-
246
-
247
-
248
-
249
-
250
-
251
-
252
-
253
-
254
-
255
-
256
-
257
-
258
-
259
-
260
-
261
-
262
-
263
-
264
-
265
-
266
-
267
-
268
-
269
-
270
-
271
-
272
-
273
-
274
-
275
-
276
-
277
-
278
-
279
-
280
-
281
-
282
-
283
-
284
-
285
 |
 |

THE TRAVELERS COMPANIES, INC. AND SUBSIDIARIES
NOTES TO CONSOLIDATED FINANCIAL STATEMENTS (Continued)
156
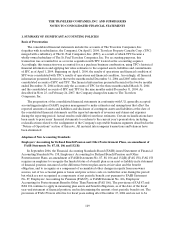
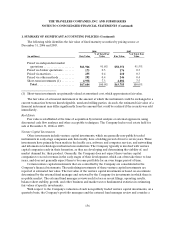
1. SUMMARY OF SIGNIFICANT ACCOUNTING POLICIES (Continued)
The following table identifies the fair value of fixed maturity securities by pricing source at
December 31, 2006 and 2005.
2006 2005
(in millions) Fair Value
% of Total Fair
Value Fair Value
% of TotalFair
Value
Priced via independent market
quotations ......................$ 61,946 91.6% $ 58,351 91.5 %
Priced via broker quotations ........ 173 0.3 176 0.3
Priced via matrices. ................ 255 0.4 210 0.3
Priced via other methods ...........292 0.4 246 0.4
Short-term investments(1).......... 4,938 7.3 4,802 7.5
Total........................... $ 67,604 100.0% $ 63,785 100.0 %
(1) Short-term investments are primarily valued at amortized cost, which approximates fairvalue.
The fair value of a financial instrument is the amount at which the instrument could be exchanged in a
current transaction between knowledgeable, unrelated willing parties. As such, the estimated fair value of a
financial instrument may differ significantly from the amount that could be realized if the security was sold
immediately.
Real Estate
Fair value is established at the time of acquisition by internal analysis or external appraisers, using
discounted cash flow analyses and other acceptable techniques. The Company had no real estate held for
sale at December 31, 2006 or 2005.
Venture Capital Investments
Other investments include venture capital investments, which are generally non-publicly traded
instruments in early-stage companies and, historically, have a holdingperiod of four to seven years. These
investments have primarily been made inthe health care, software and computer services, andnetworking
and information technologies infrastructures industries. The Company typically is involved with venture
capital companies early in their formation, as theyare developing and determining the viability of, and
market demand for, their product. Generally, the Company does not expect these venture capital
companies to record revenues in the early stages of their development, which can often take three to four
years, and does not generally expect them to become profitable for an even longer period of time.
Certain venture capital investments that are controlled by the Company are consolidated in the
Company’s financial statements. The underlying investments of these venture capital investments are
reported at estimated fair value.The fair value of the venture capital investments is based on an estimate
determined by the external fund manager and reviewed by the Company for investments in which there is
no public market. Theexternal fund manager reviews such factors as recent filings, operating results,
balance sheet stability, growth, and other business and market sector fundamental statistics in estimating
fair values of specific investments.
With respect to the Company’s valuation of such non-publicly traded venture capital investments, on a
quarterly basis, the Company’s portfolio managers and the external fund manager review and consider a