Travelers 2006 Annual Report Download - page 94
Download and view the complete annual report
Please find page 94 of the 2006 Travelers annual report below. You can navigate through the pages in the report by either clicking on the pages listed below, or by using the keyword search tool below to find specific information within the annual report.-
 1
1 -
2
-
3
-
4
-
5
-
6
-
7
-
8
-
9
-
10
-
11
-
12
-
13
-
14
-
15
-
16
-
17
-
18
-
19
-
20
-
21
-
22
-
23
-
24
-
25
-
26
-
27
-
28
-
29
-
30
-
31
-
32
-
33
-
34
-
35
-
36
-
37
-
38
-
39
-
40
-
41
-
42
-
43
-
44
-
45
-
46
-
47
-
48
-
49
-
50
-
51
-
52
-
53
-
54
-
55
-
56
-
57
-
58
-
59
-
60
-
61
-
62
-
63
-
64
-
65
-
66
-
67
-
68
-
69
-
70
-
71
-
72
-
73
-
74
-
75
-
76
-
77
-
78
-
79
-
80
-
81
-
82
-
83
-
 84
84 -
 85
85 -
 86
86 -
 87
87 -
 88
88 -
 89
89 -
 90
90 -
 91
91 -
 92
92 -
 93
93 -
 94
94 -
 95
95 -
 96
96 -
 97
97 -
 98
98 -
 99
99 -
 100
100 -
 101
101 -
 102
102 -
 103
103 -
 104
104 -
105
-
106
-
107
-
108
-
109
-
110
-
111
-
112
-
113
-
114
-
115
-
116
-
117
-
118
-
119
-
120
-
121
-
122
-
123
-
124
-
125
-
126
-
127
-
128
-
129
-
130
-
131
-
132
-
133
-
134
-
135
-
136
-
137
-
138
-
139
-
140
-
141
-
142
-
143
-
144
-
145
-
146
-
147
-
148
-
149
-
150
-
151
-
152
-
153
-
154
-
155
-
156
-
157
-
158
-
159
-
160
-
161
-
162
-
163
-
164
-
165
-
166
-
167
-
168
-
169
-
170
-
171
-
172
-
173
-
174
-
175
-
176
-
177
-
178
-
179
-
180
-
181
-
182
-
183
-
184
-
185
-
186
-
187
-
188
-
189
-
190
-
191
-
192
-
193
-
194
-
195
-
196
-
197
-
198
-
199
-
200
-
201
-
202
-
203
-
204
-
205
-
206
-
207
-
208
-
209
-
210
-
211
-
212
-
213
-
214
-
215
-
216
-
217
-
218
-
219
-
220
-
221
-
222
-
223
-
224
-
225
-
226
-
227
-
228
-
229
-
230
-
231
-
232
-
233
-
234
-
235
-
236
-
237
-
238
-
239
-
240
-
241
-
242
-
243
-
244
-
245
-
246
-
247
-
248
-
249
-
250
-
251
-
252
-
253
-
254
-
255
-
256
-
257
-
258
-
259
-
260
-
261
-
262
-
263
-
264
-
265
-
266
-
267
-
268
-
269
-
270
-
271
-
272
-
273
-
274
-
275
-
276
-
277
-
278
-
279
-
280
-
281
-
282
-
283
-
284
-
285
 |
 |
82
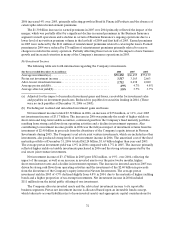
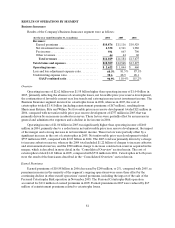
The $187 million increase in earnedpremiums in 2005 compared with 2004 primarily reflected the
impact of the merger, which was largely offset by a significant decline in runoff operations, where business
was intentionally being non-renewed, and a decline in certain ongoing operations due to a lower level of
written premium volume inthe last half of 2004 and first half of 2005. In addition, catastrophe-related
reinstatement premiums reducednet earned premium volume in 2005 by $67 million.
Net Investment Income
Refer to the “Net Investment Income” section of the “Consolidated Results of Operations” discussion
herein for a description of the factors contributing to the increase in the Company’s net investment income
in 2006 and 2005.
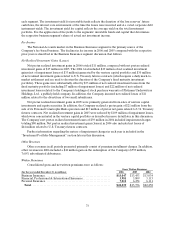
Fee Income
National Accounts is the primary source of fee income due to its service businesses, which include
claim and loss prevention services to large companies that choose to self-insure a portion of their insurance
risks, and claims and policy management services toworkers’ compensation residual market pools. The $72
million decline in fee income in 2006 resulted from lower serviced claim volume in workers’ compensation
residual market pools, the impact on fee income from lower loss costs due to California workers’
compensation reforms and lower new business volume due to increased competition. In 2005, the $43
million decline in fee income compared with 2004 was primarily due to increased competition, including
the loss of several large customers in the second half of 2004 and early 2005.
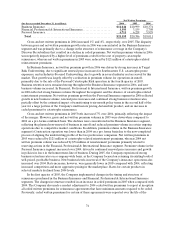
Claims and Expenses
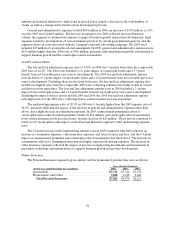
Claim and claim adjustment expenses in 2006 totaled $6.85 billion,down $2.51 billion from the 2005
total of $9.36 billion. The 2005 total included catastrophe losses of $1.32 billion, nearly all of which
resulted from Hurricanes Katrina, Rita and Wilma, whereas the 2006 total included no catastrophe losses.
Net favorable prior year reserve development totaled $21 million in 2006. Net unfavorable prior year
reserve development in 2005 was $757 million. The 2006 net favorable prior year reserve development was
primarily concentratedin the commercial multi-peril, general liability, property andcommercial
automobile lines of business, partially offset by increases to asbestos and environmental reserves, as well as
reserve strengthening for assumed reinsurance business in runoff. The commercial multi-peril and liability
lines of business experienced better than anticipated loss development that was attributable to several
factors, including improving legal and judicial environments, as well as enhanced risk control, underwriting
and claim process initiatives. The favorable prior year reserve development in the property line of business
primarily reflected less “demand surge” inflation than originally estimated for 2005 accident year non-
catastrophe and catastrophe losses. “Demand surge” refers to significant short-term increases in building
material and labor costs due to a sharp increase in demandfor those materials and services. The
commercial automobile line of business experienced better than expected loss development which was
attributable to the favorable legal and judicial environments, claim handling initiatives focused on the
automobile line of insurance and improvements in auto safety technology. The reserve strengthening in
assumed reinsurance was primarily due to changes in projected loss development driven by an
unanticipated change in the claim settlement patterns of theunderlying casualty exposures. In 2005, net
unfavorable prior year reserve development was driven by an increase to asbestos reserves of $830 million
and reserve strengthening for environmental and assumed reinsurance, which is in runoff. Those increases
were partiallyoffset by favorable prior year reserve development from lower frequency and severity for
both casualty and property-related lines of business. Drivers of the reduction in both frequency and
severity were increasingly favorable legal and judicial environments, coupled with better than expected
results from changes in policy provisions as well as underwriting and pricing criteria. Company initiatives
relating to claims handling, which affected claims staffing and workflows, also are believed to have
contributed to the emergence of favorable severity experience in 2005.