Travelers 2006 Annual Report Download - page 184
Download and view the complete annual report
Please find page 184 of the 2006 Travelers annual report below. You can navigate through the pages in the report by either clicking on the pages listed below, or by using the keyword search tool below to find specific information within the annual report.-
 1
1 -
2
-
3
-
4
-
5
-
6
-
7
-
8
-
9
-
10
-
11
-
12
-
13
-
14
-
15
-
16
-
17
-
18
-
19
-
20
-
21
-
22
-
23
-
24
-
25
-
26
-
27
-
28
-
29
-
30
-
31
-
32
-
33
-
34
-
35
-
36
-
37
-
38
-
39
-
40
-
41
-
42
-
43
-
44
-
45
-
46
-
47
-
48
-
49
-
50
-
51
-
52
-
53
-
54
-
55
-
56
-
57
-
58
-
59
-
60
-
61
-
62
-
63
-
64
-
65
-
66
-
67
-
68
-
69
-
70
-
71
-
72
-
73
-
74
-
75
-
76
-
77
-
78
-
79
-
80
-
81
-
82
-
83
-
84
-
85
-
86
-
87
-
88
-
89
-
90
-
91
-
92
-
93
-
94
-
95
-
96
-
97
-
98
-
99
-
100
-
101
-
102
-
103
-
104
-
105
-
106
-
107
-
108
-
109
-
110
-
111
-
112
-
113
-
114
-
115
-
116
-
117
-
118
-
119
-
120
-
121
-
122
-
123
-
124
-
125
-
126
-
127
-
128
-
129
-
130
-
131
-
132
-
133
-
134
-
135
-
136
-
137
-
138
-
139
-
140
-
141
-
142
-
143
-
144
-
145
-
146
-
147
-
148
-
149
-
150
-
151
-
152
-
153
-
154
-
155
-
156
-
157
-
158
-
159
-
160
-
161
-
162
-
163
-
164
-
165
-
166
-
167
-
168
-
169
-
170
-
171
-
172
-
173
-
 174
174 -
 175
175 -
 176
176 -
 177
177 -
 178
178 -
 179
179 -
 180
180 -
 181
181 -
 182
182 -
 183
183 -
 184
184 -
 185
185 -
 186
186 -
 187
187 -
 188
188 -
 189
189 -
 190
190 -
 191
191 -
 192
192 -
 193
193 -
 194
194 -
195
-
196
-
197
-
198
-
199
-
200
-
201
-
202
-
203
-
204
-
205
-
206
-
207
-
208
-
209
-
210
-
211
-
212
-
213
-
214
-
215
-
216
-
217
-
218
-
219
-
220
-
221
-
222
-
223
-
224
-
225
-
226
-
227
-
228
-
229
-
230
-
231
-
232
-
233
-
234
-
235
-
236
-
237
-
238
-
239
-
240
-
241
-
242
-
243
-
244
-
245
-
246
-
247
-
248
-
249
-
250
-
251
-
252
-
253
-
254
-
255
-
256
-
257
-
258
-
259
-
260
-
261
-
262
-
263
-
264
-
265
-
266
-
267
-
268
-
269
-
270
-
271
-
272
-
273
-
274
-
275
-
276
-
277
-
278
-
279
-
280
-
281
-
282
-
283
-
284
-
285
 |
 |

THE TRAVELERS COMPANIES, INC. AND SUBSIDIARIES
NOTES TO CONSOLIDATED FINANCIAL STATEMENTS (Continued)
172
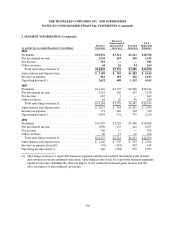
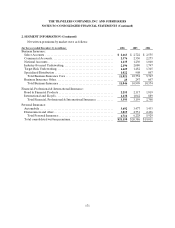
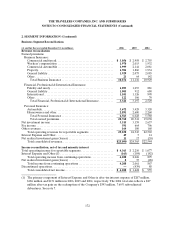
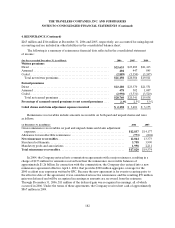
2. SEGMENT INFORMATION (Continued)
Business Segment Reconciliations
(at and for the year ended December 31, in millions)2006 2005 2004
Revenue reconciliation
Earned premiums
Business Insurance:
Commercial multi-peril. ........................................ $3,056 $2,958 $2,755
Workers’ compensation........................................ 1,970 2,015 1,932
Commercial automobile ........................................ 1,999 2,144 2,081
Property ...................................................... 1,901 1,860 1,934
General liability ............................................... 1,929 2,075 2,085
Other........................................................ 21 64 142
Total BusinessInsurance..................................... 10,876 11,116 10,929
Financial, Professional & International Insurance:
Fidelity and surety............................................. 1,093 1,053 881
General liability ............................................... 1,005 912 680
International.................................................. 1,101 1,126 898
Other........................................................ 122 106 70
TotalFinancial, Professional & International Insurance.......... 3,321 3,197 2,529
Personal Insurance:
Automobile ................................................... 3,672 3,428 3,320
Homeowners and other. ........................................ 2,891 2,600 2,260
Total PersonalInsurance ..................................... 6,563 6,028 5,580
Total earnedpremiums. ...................................... 20,760 20,341 19,038
Net investment income............................................. 3,515 3,158 2,657
Fee income ....................................................... 591 664 706
Other revenues .................................................... 164 180 168
Totaloperating revenues for reportable segments. ................. 25,030 24,343 22,569
Interest Expense and Other ......................................... 49 5 14
Net realized investment gains (losses) ................................ 11 17 (39)
Total consolidated revenues..................................... $25,090 $ 2 4,365 $ 2 2,544
Income reconciliation, net of tax and minority interest
Total operating income for reportable segments ....................... $4,363 $2,210 $1,077
Interest Expense and Other(1)...................................... (163) (184 ) (182)
Totaloperating income from continuing operations ................ 4,200 2,026 895
Net realized investment gains (losses) ................................ 8 35 (28)
Total income fromcontinuingoperations......................... 4,208 2,061 867
Discontinued operations ............................................ — (439 ) 88
Total consolidated net income................................... $4,208 $1,622 $ 955
(1) The primary component of Interest Expense and Other is after-tax interest expense of $207 million,
$186 million and $151 million in2006, 2005 and 2004, respectively. The 2006 total also reflects a $27
million after-tax gain on the redemption of the Company’s $593 million,7.60% subordinated
debentures. See note 7.